> ## Documentation Index
> Fetch the complete documentation index at: https://openmetadata-docs-release-watchers.mintlify.site/llms.txt
> Use this file to discover all available pages before exploring further.
# Explore the Lineage View | Official Documentation
> Explore lineage diagrams interactively to understand how data flows between sources, transformations, and dashboards.
# Explore the Lineage View
OpenMetadata's Lineage view shows end-to-end data flow at both the table and column level, for Database, Dashboard, and Pipeline assets.
Search for a data asset and expand the graph to see its lineage:
* Each node expands to show its upstream and downstream edges.
* Each edge carries details such as the SQL query, pipeline information, and column-level lineage.
## Source, Target, and Edges
In the example below:
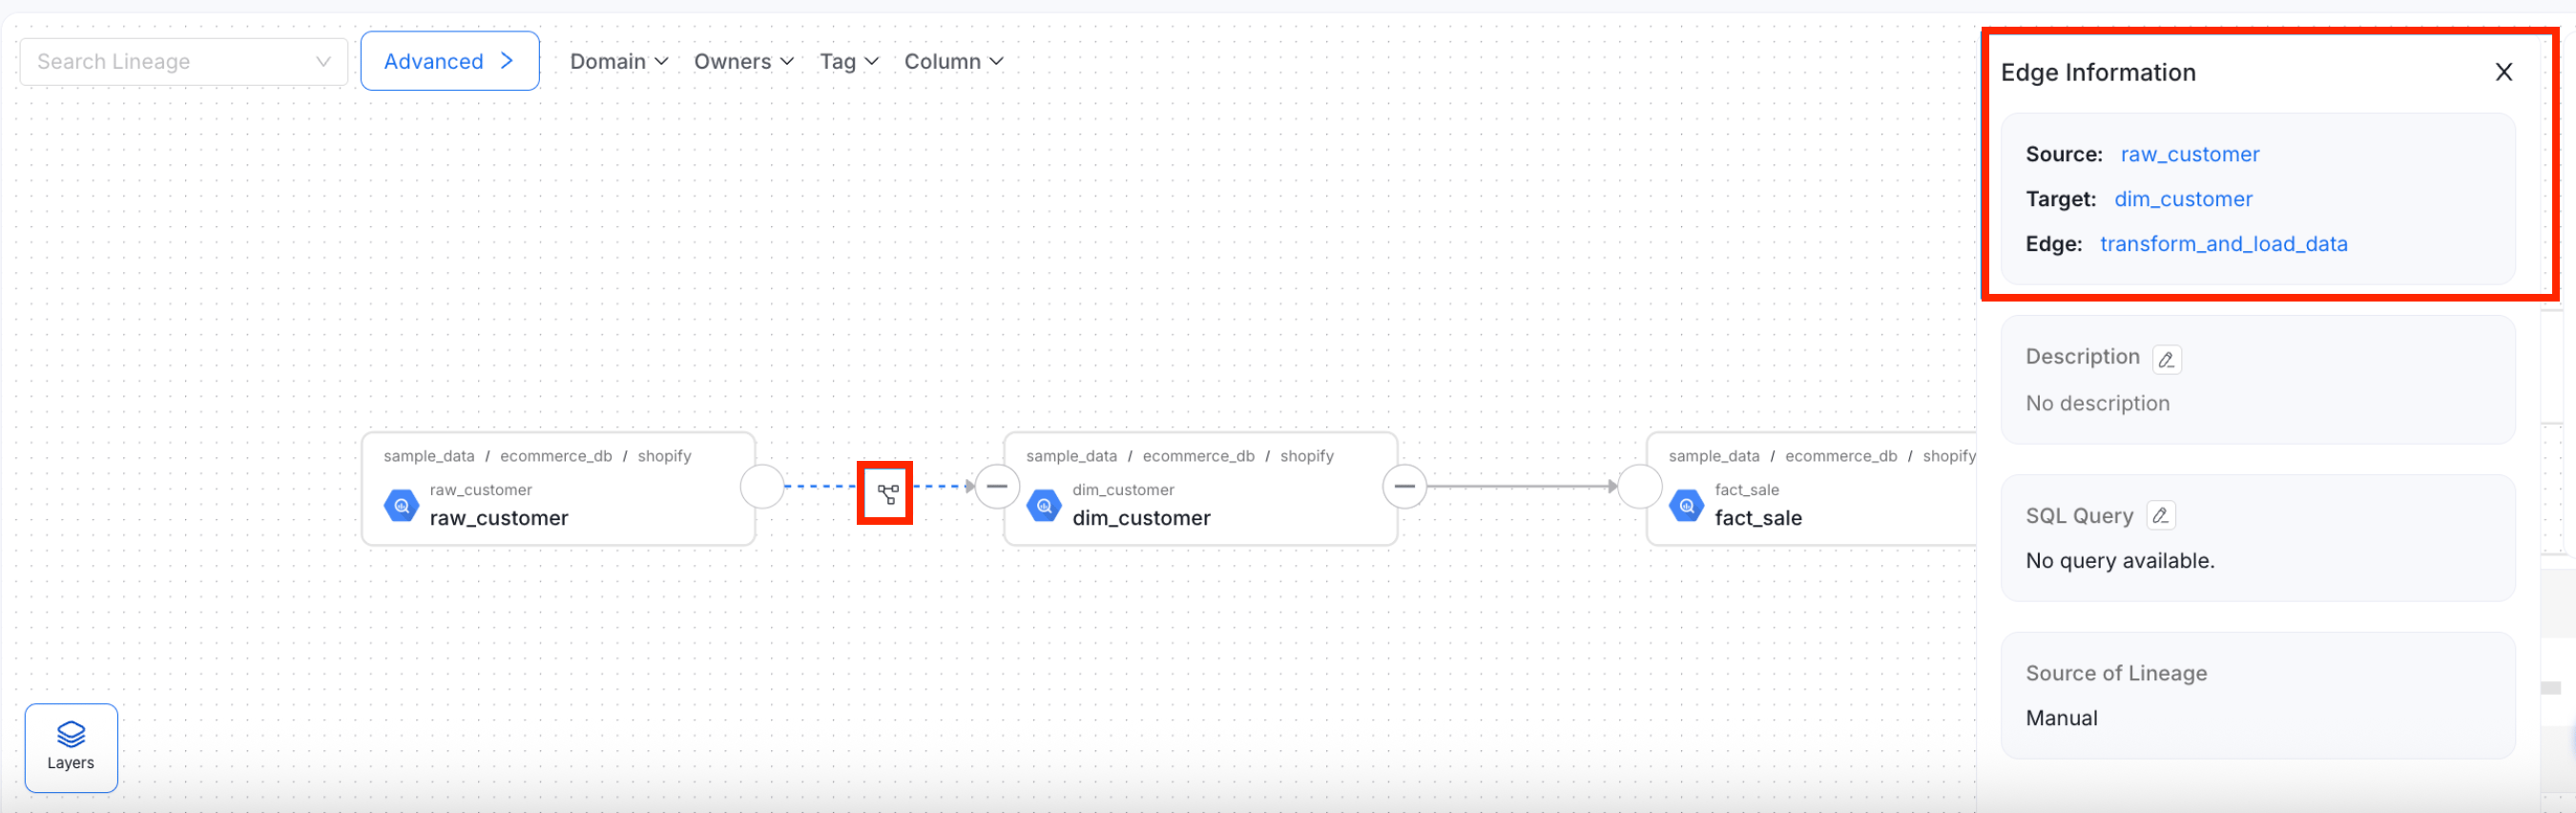
* The table on the left is the parent, or **Source** node.
* The table on the right is the **Target** node — identifiable by the arrow pointing into it.
* The arrow connecting them is the **Edge**.
Click an edge to see its details: the Source, Target, Description, and SQL Query. For a view, the SQL query shows how the target was generated from the source.
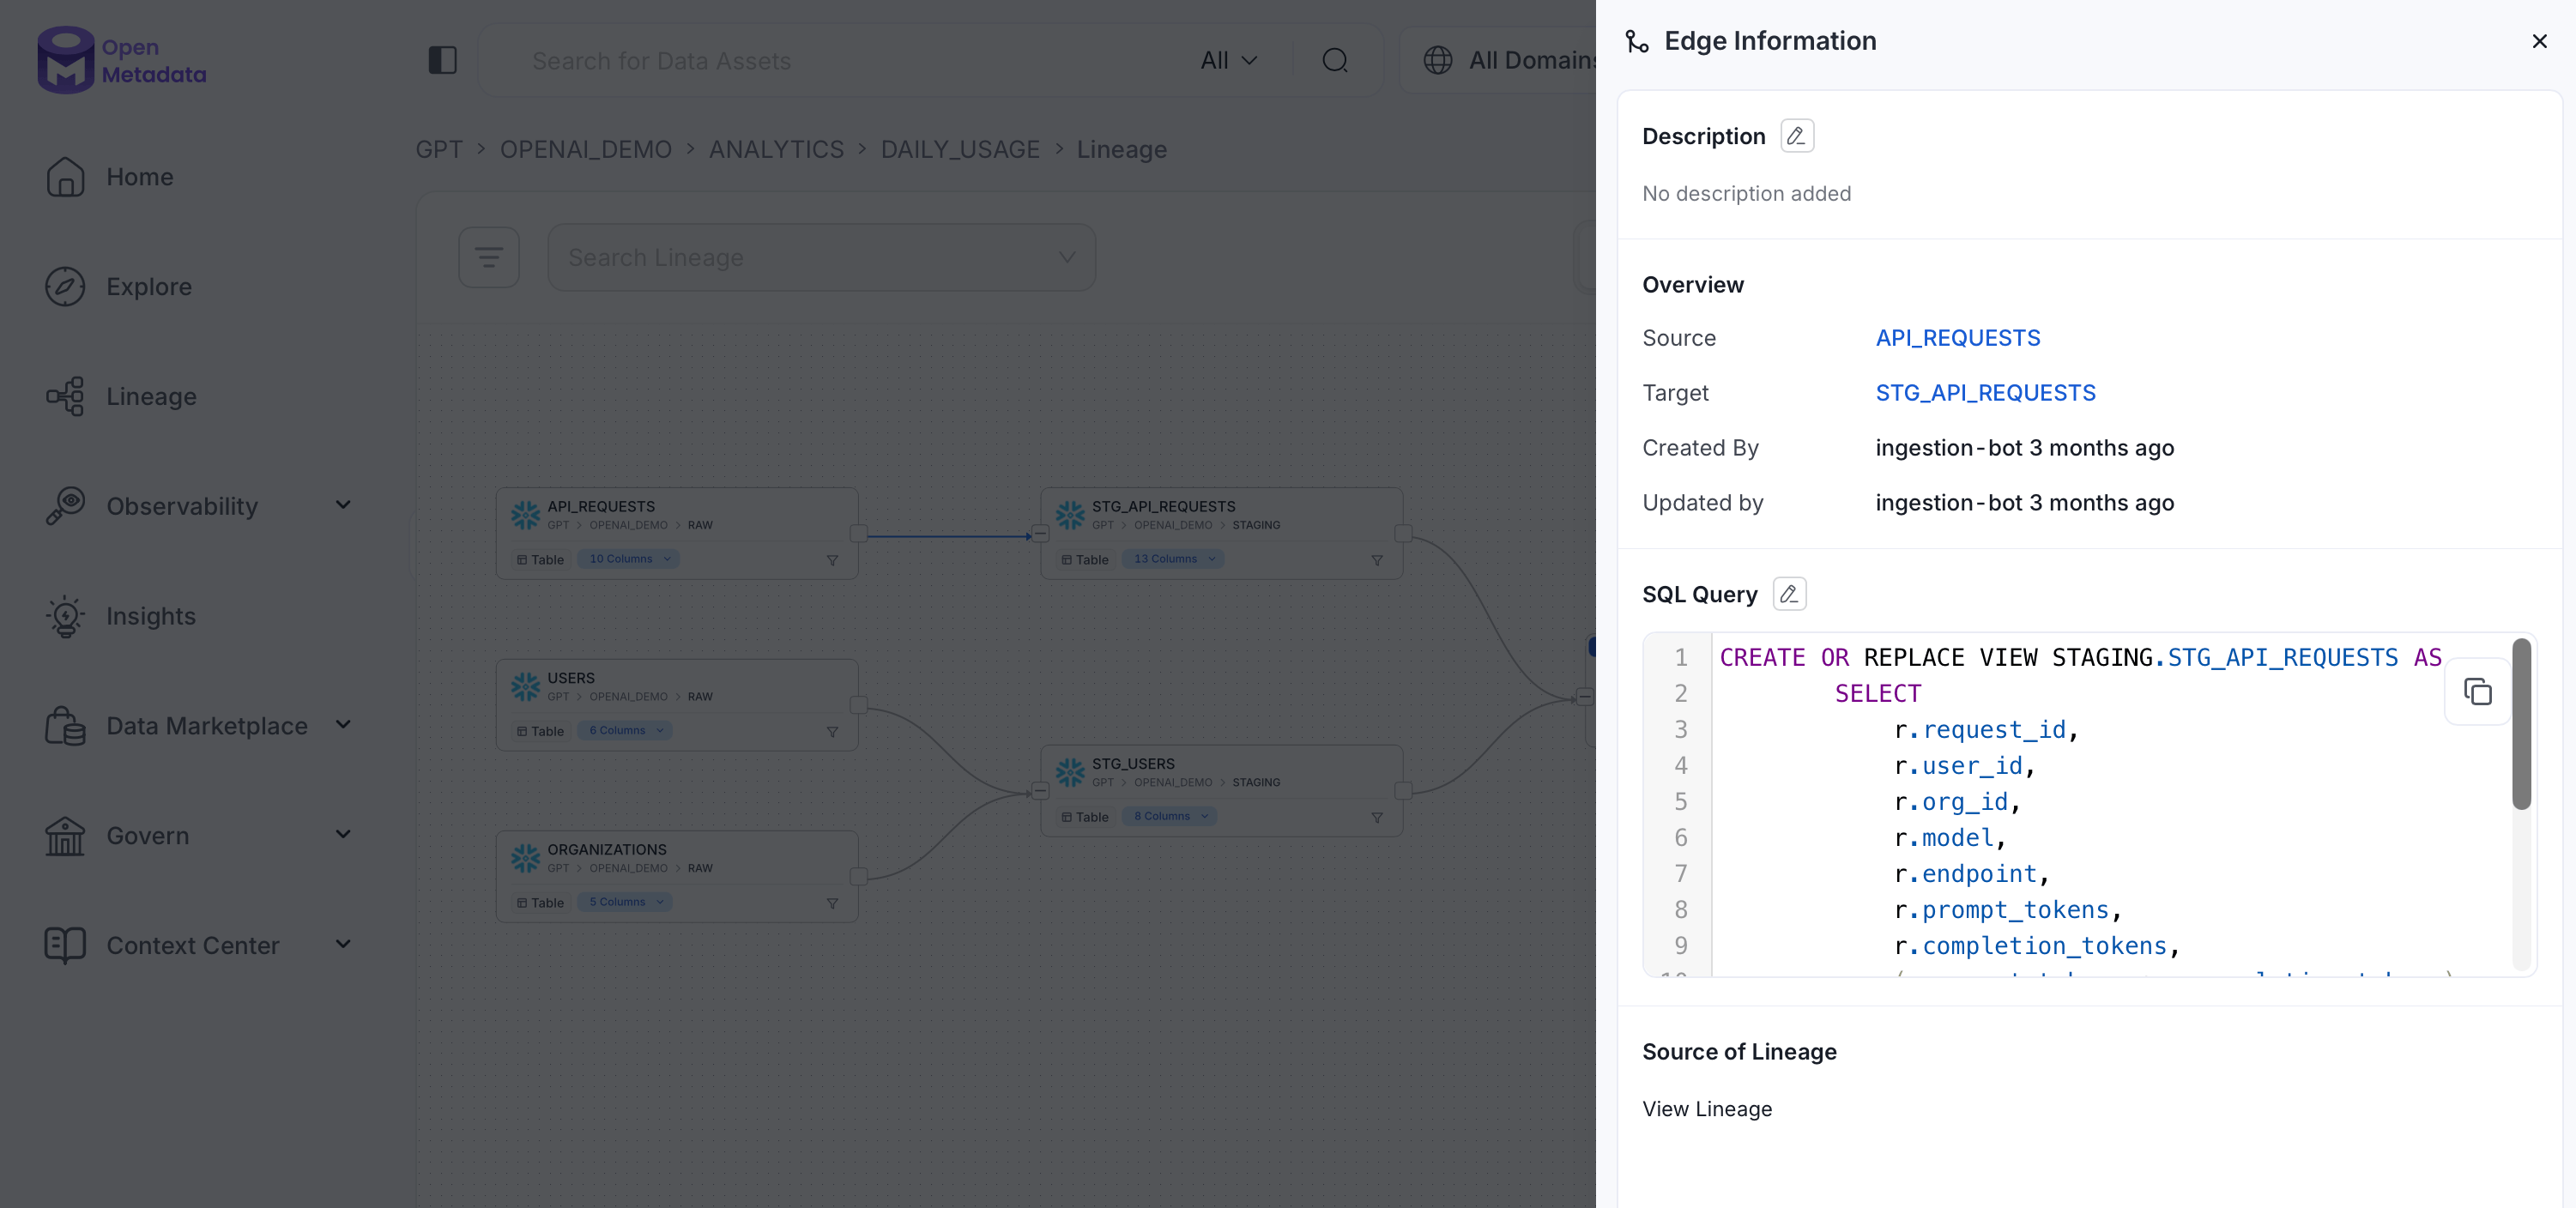 Metadata ingestion also brings in view lineage, if the database has views (data assets of the type View).
## Lineage Config
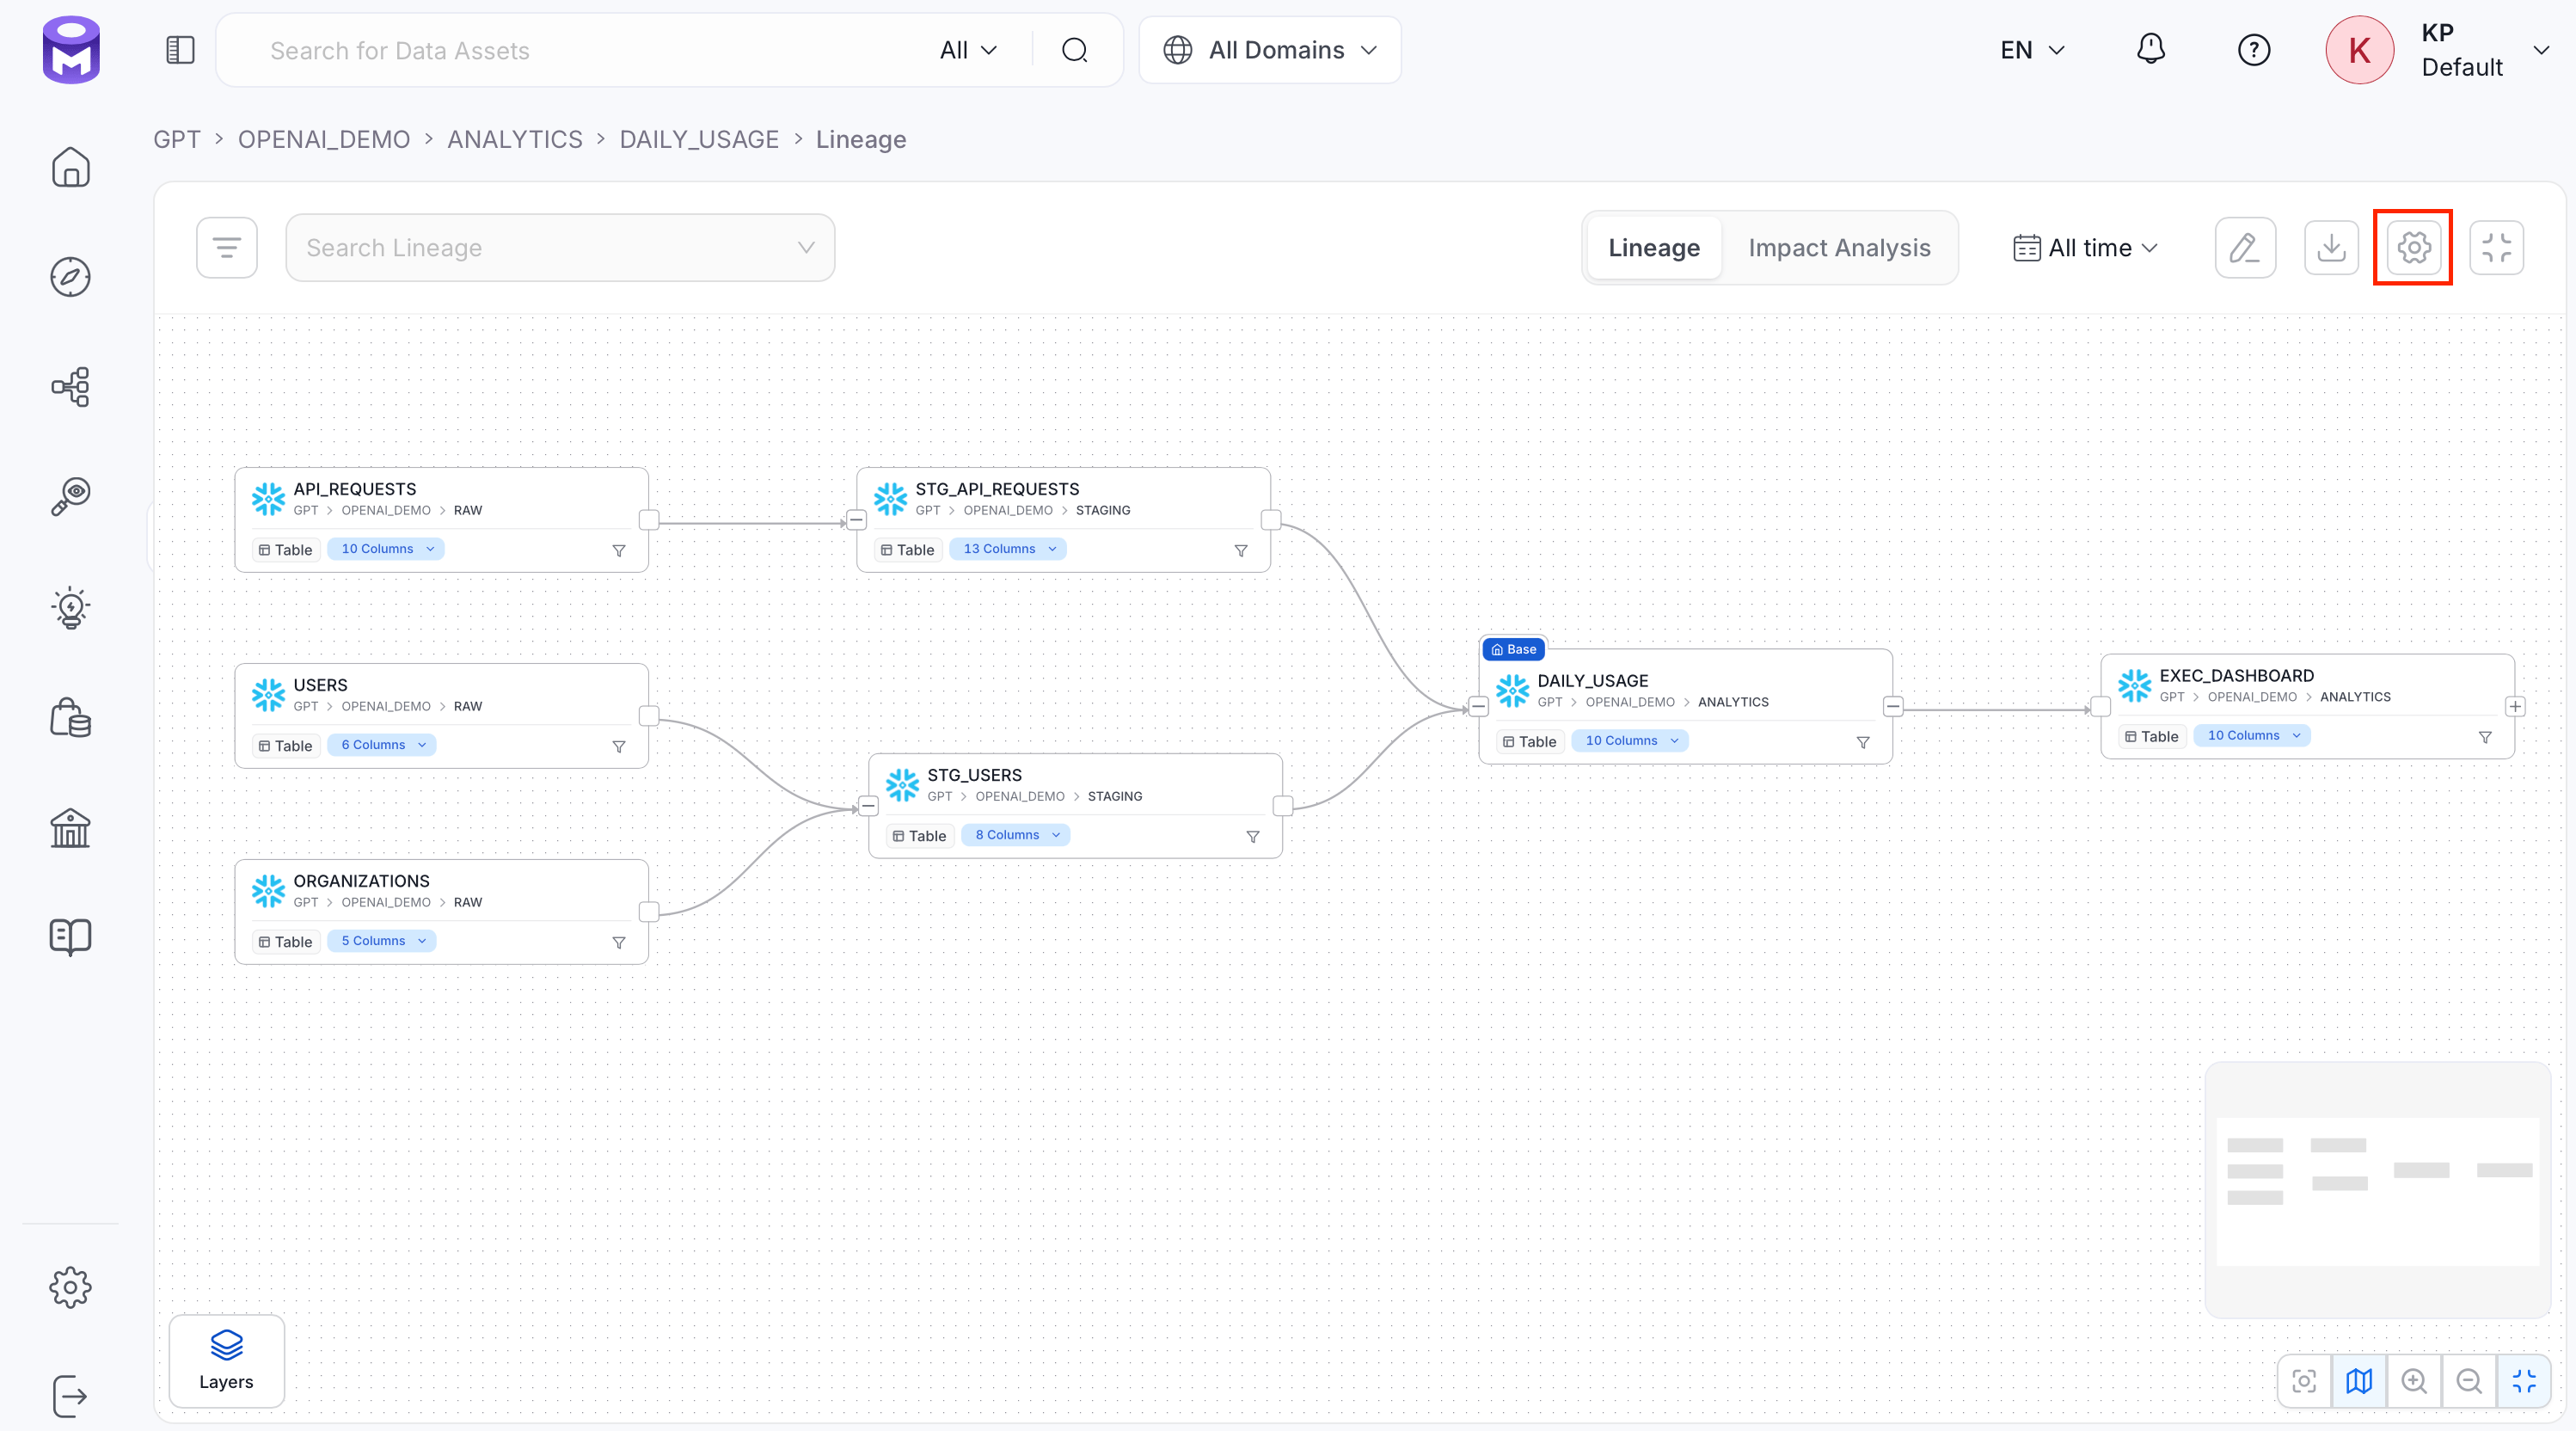
Use the gear icon's **Lineage Config** to change how many Upstream and Downstream Nodes this view displays, as well as the Nodes per layer. None of these fields have a fixed maximum. This only affects your current view: it resets to the platform default the next time you open a lineage graph.
To configure the lineage nodes, follow the steps below:
1. Click the **Setting** icon.
Metadata ingestion also brings in view lineage, if the database has views (data assets of the type View).
## Lineage Config
Use the gear icon's **Lineage Config** to change how many Upstream and Downstream Nodes this view displays, as well as the Nodes per layer. None of these fields have a fixed maximum. This only affects your current view: it resets to the platform default the next time you open a lineage graph.
To configure the lineage nodes, follow the steps below:
1. Click the **Setting** icon.
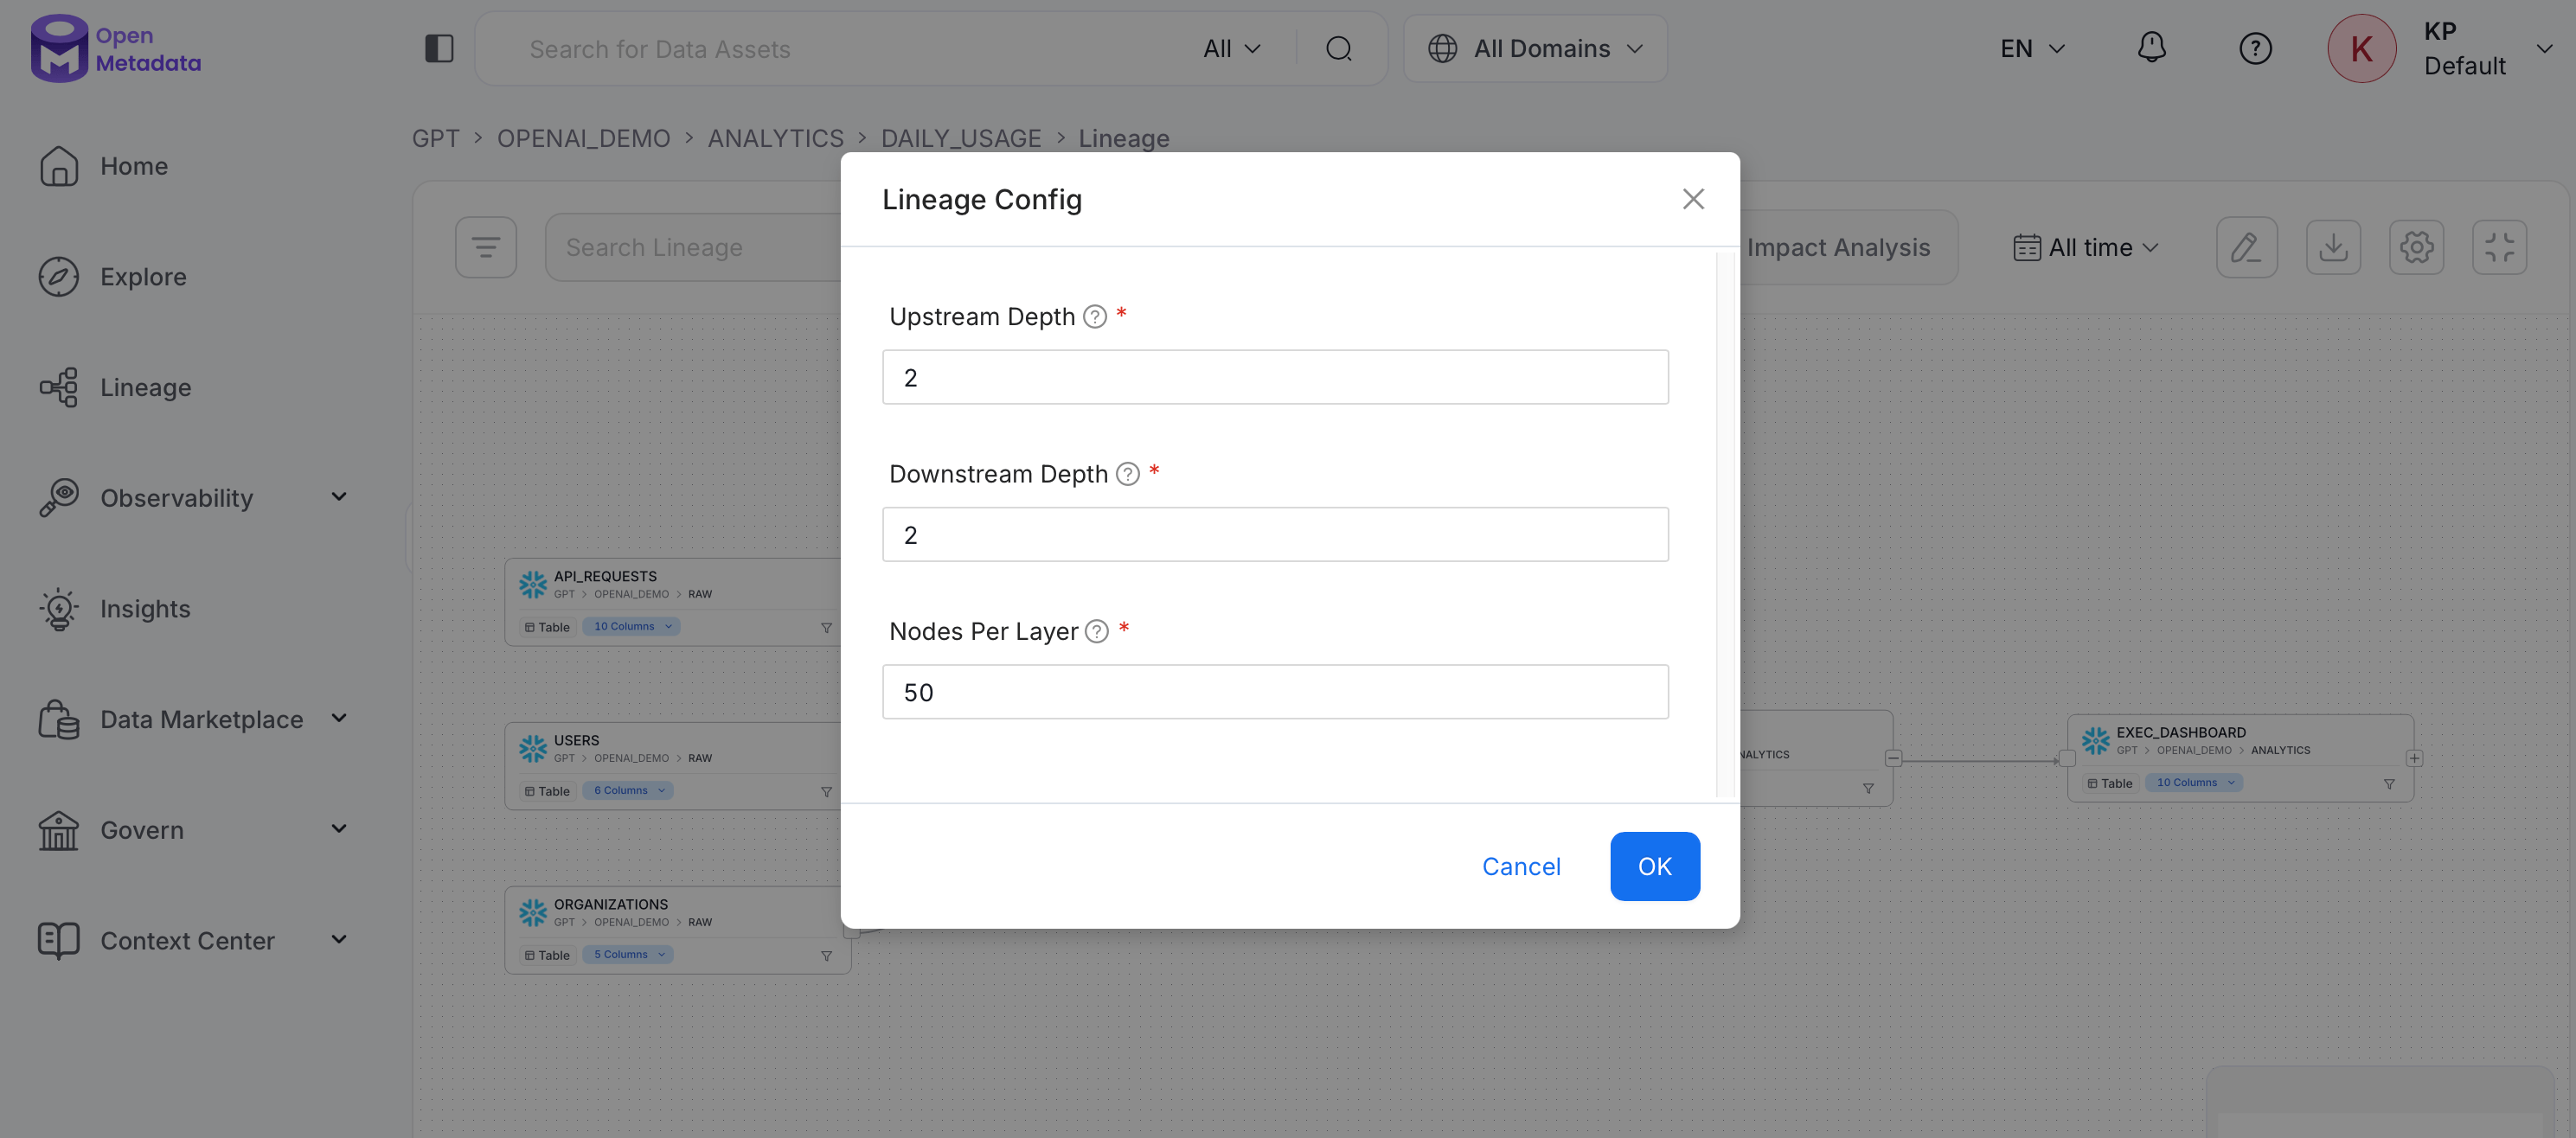
 2. Set the following:
* **Upstream Depth**: Number of upstream hops shown by default when opening a lineage graph, to identify parent-level sources.
* **Downstream Depth**: Number of downstream hops shown by default when opening a lineage graph, to identify child-level targets.
* **Nodes Per Layer**: Maximum number of nodes shown per layer. If a layer has more nodes than this, the rest are paginated instead of all being rendered at once.
2. Set the following:
* **Upstream Depth**: Number of upstream hops shown by default when opening a lineage graph, to identify parent-level sources.
* **Downstream Depth**: Number of downstream hops shown by default when opening a lineage graph, to identify child-level targets.
* **Nodes Per Layer**: Maximum number of nodes shown per layer. If a layer has more nodes than this, the rest are paginated instead of all being rendered at once.
 To change the default for every session, see [Lineage](/v1.13.x/how-to-guides/admin-guide/preferences/lineage).
## Impact Analysis View
The Lineage page has two tabs at the top: **Lineage** (the graph you've seen so far) and **Impact Analysis** — a table that lists the same upstream and downstream assets as rows instead of nodes on a graph, which is easier to scan, search, and sort when an asset has a large number of dependencies.
To change the default for every session, see [Lineage](/v1.13.x/how-to-guides/admin-guide/preferences/lineage).
## Impact Analysis View
The Lineage page has two tabs at the top: **Lineage** (the graph you've seen so far) and **Impact Analysis** — a table that lists the same upstream and downstream assets as rows instead of nodes on a graph, which is easier to scan, search, and sort when an asset has a large number of dependencies.
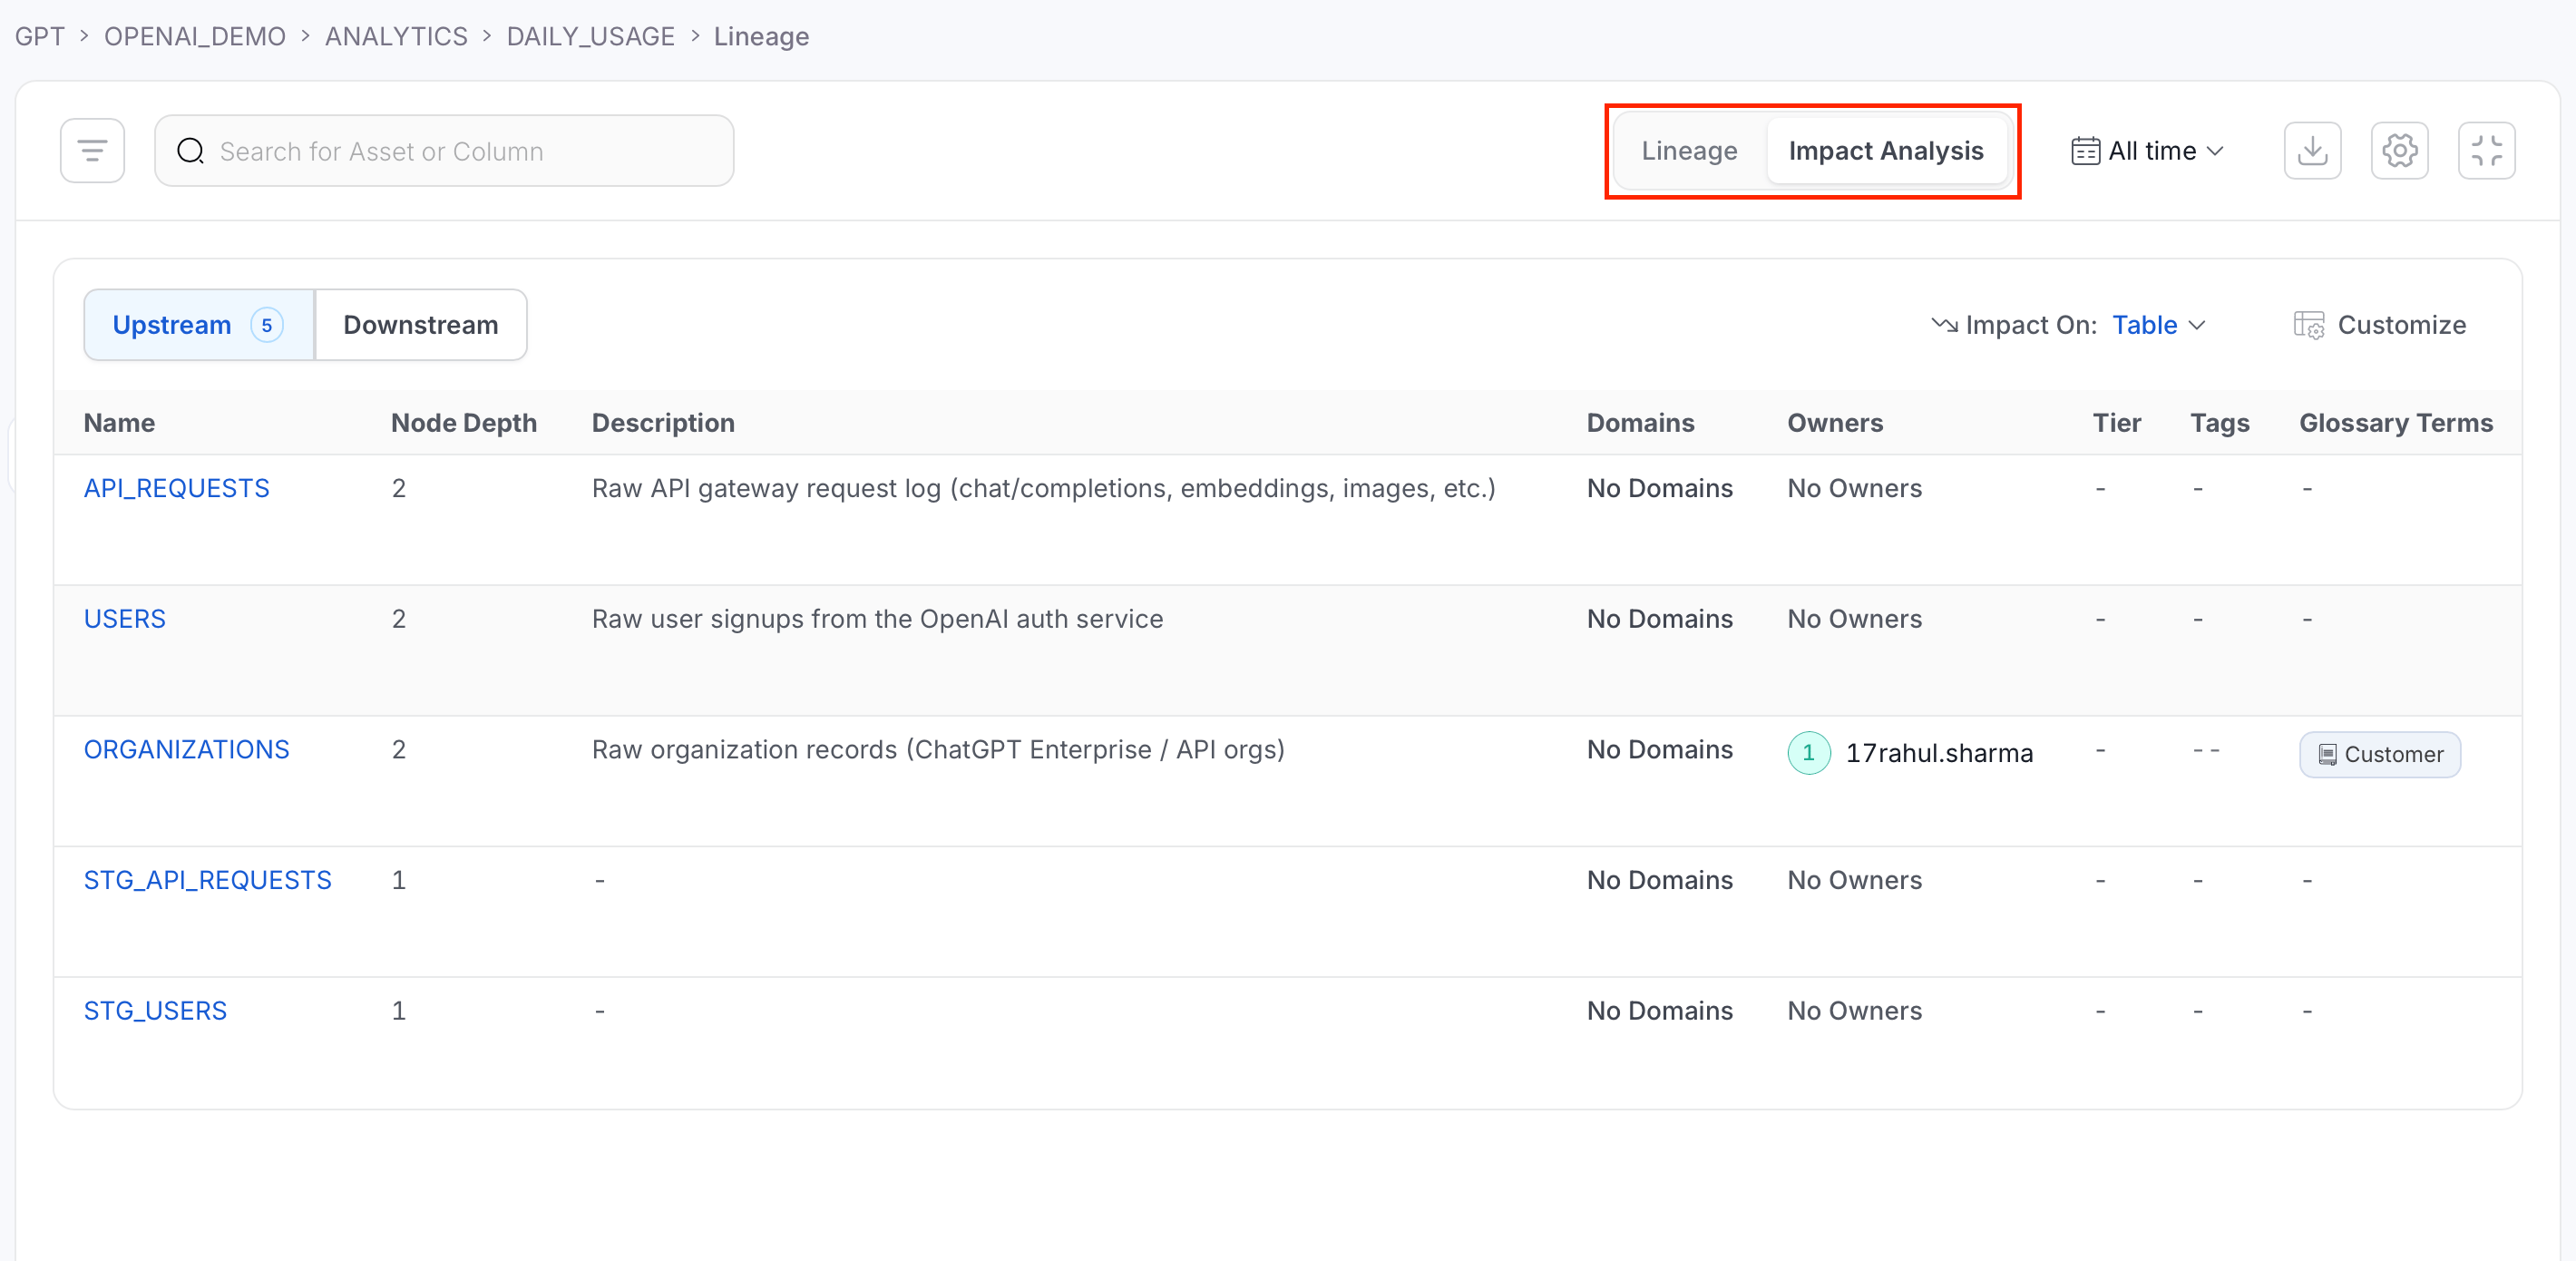 * **Upstream / Downstream**: Switch direction. Each option shows a count of how many assets lie in that direction.
* **Impact On**: Choose whether the table lists **Asset Level** impact (one row per table, pipeline, dashboard, and so on) or **Column Level** impact (one row per source-to-target column mapping).
* **Customize**: Choose which columns to show. Name (or Source/Impacted Column, in Column Level mode) always stays visible. Every other column can be toggled off.
* Search narrows the rows by asset name (Asset Level) or column name (Column Level).
**Asset Level** columns: Name, Node Depth (number of hops from the asset you're viewing), Description, Domains, Owners, Tier, Tags, and Glossary Terms.
**Column Level** columns: Source, Source Column, Impacted (the downstream or upstream asset), Impacted Column, plus the same Node Depth, Description, Domains, Owners, Tier, Tags, and Glossary Terms columns.
## Data Asset Details
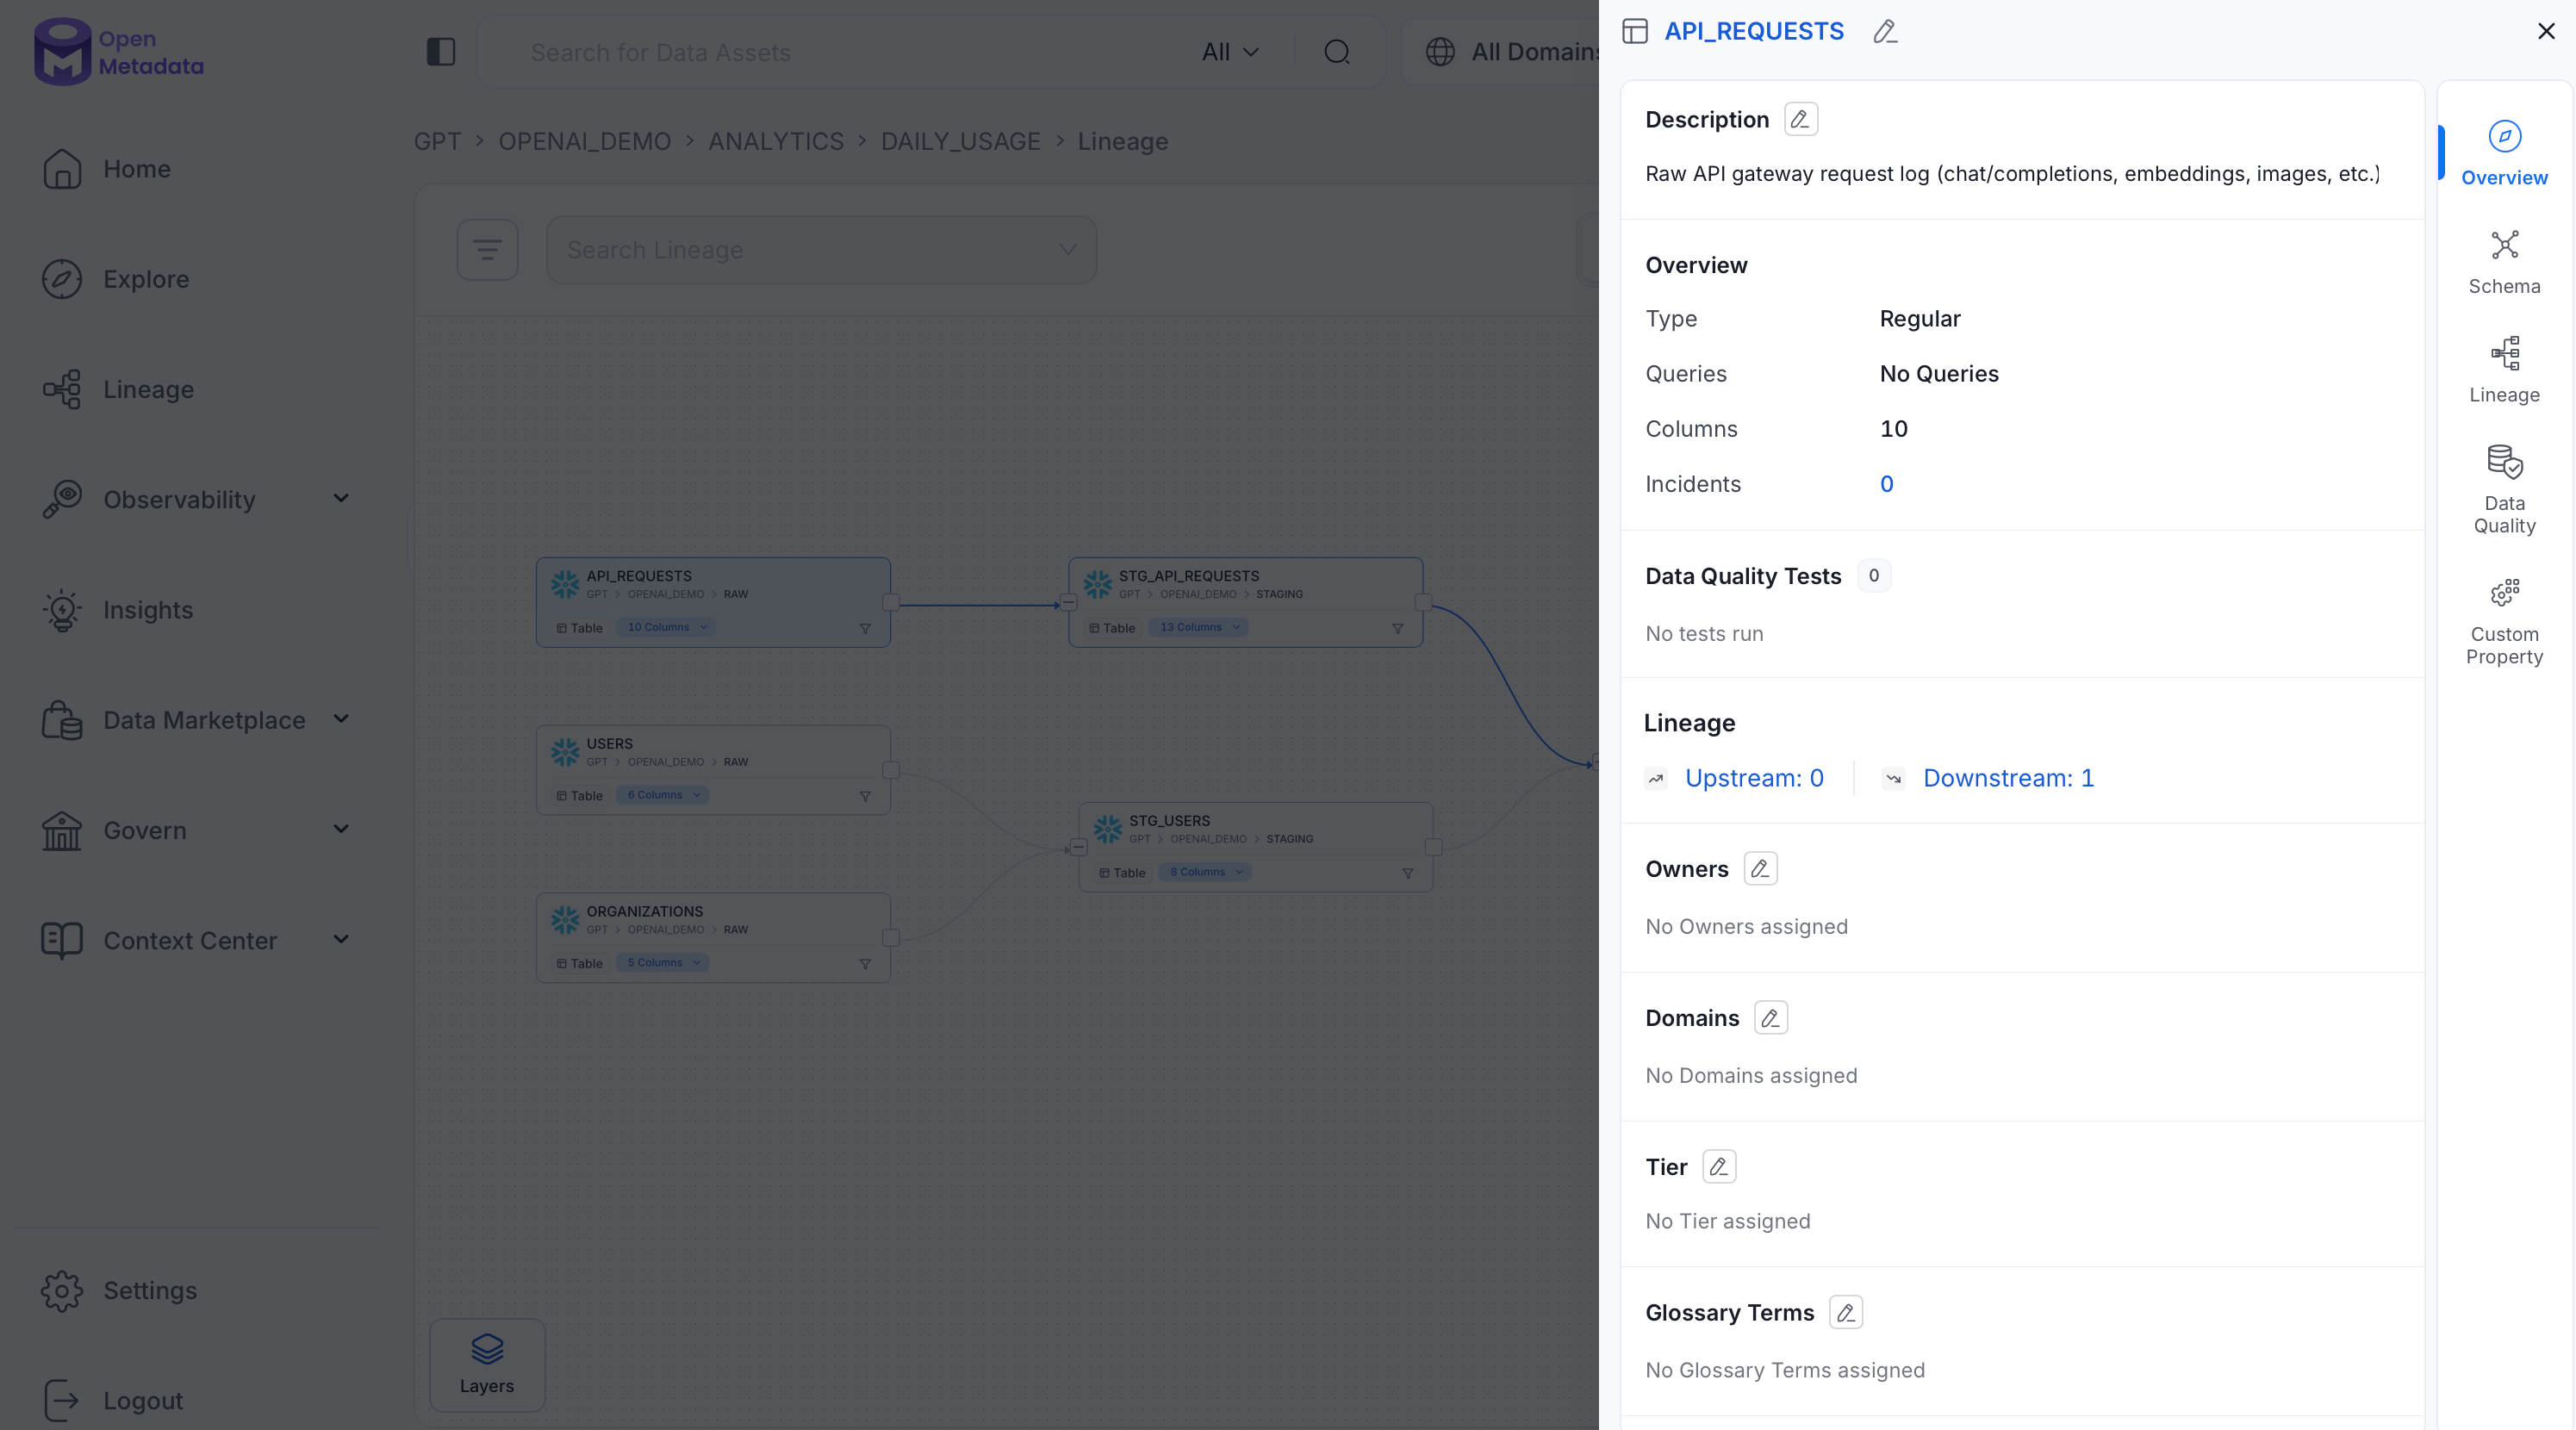
Click a data asset to view its details:
* **Source, Name, Description, Owner** (team/user), **Tier**, and **Usage** information.
* Additional details based on the **type of data asset** (Table, Topic, Dashboard, Pipeline, ML Model, Container) — for example, a table's type, number of queries, and columns.
* **Data quality and profiler metrics**, including tests passed, aborted, and failed.
* **Tags** associated with the data asset.
* **Schema** details: column names, column types, and column descriptions.
* **Upstream / Downstream**: Switch direction. Each option shows a count of how many assets lie in that direction.
* **Impact On**: Choose whether the table lists **Asset Level** impact (one row per table, pipeline, dashboard, and so on) or **Column Level** impact (one row per source-to-target column mapping).
* **Customize**: Choose which columns to show. Name (or Source/Impacted Column, in Column Level mode) always stays visible. Every other column can be toggled off.
* Search narrows the rows by asset name (Asset Level) or column name (Column Level).
**Asset Level** columns: Name, Node Depth (number of hops from the asset you're viewing), Description, Domains, Owners, Tier, Tags, and Glossary Terms.
**Column Level** columns: Source, Source Column, Impacted (the downstream or upstream asset), Impacted Column, plus the same Node Depth, Description, Domains, Owners, Tier, Tags, and Glossary Terms columns.
## Data Asset Details
Click a data asset to view its details:
* **Source, Name, Description, Owner** (team/user), **Tier**, and **Usage** information.
* Additional details based on the **type of data asset** (Table, Topic, Dashboard, Pipeline, ML Model, Container) — for example, a table's type, number of queries, and columns.
* **Data quality and profiler metrics**, including tests passed, aborted, and failed.
* **Tags** associated with the data asset.
* **Schema** details: column names, column types, and column descriptions.
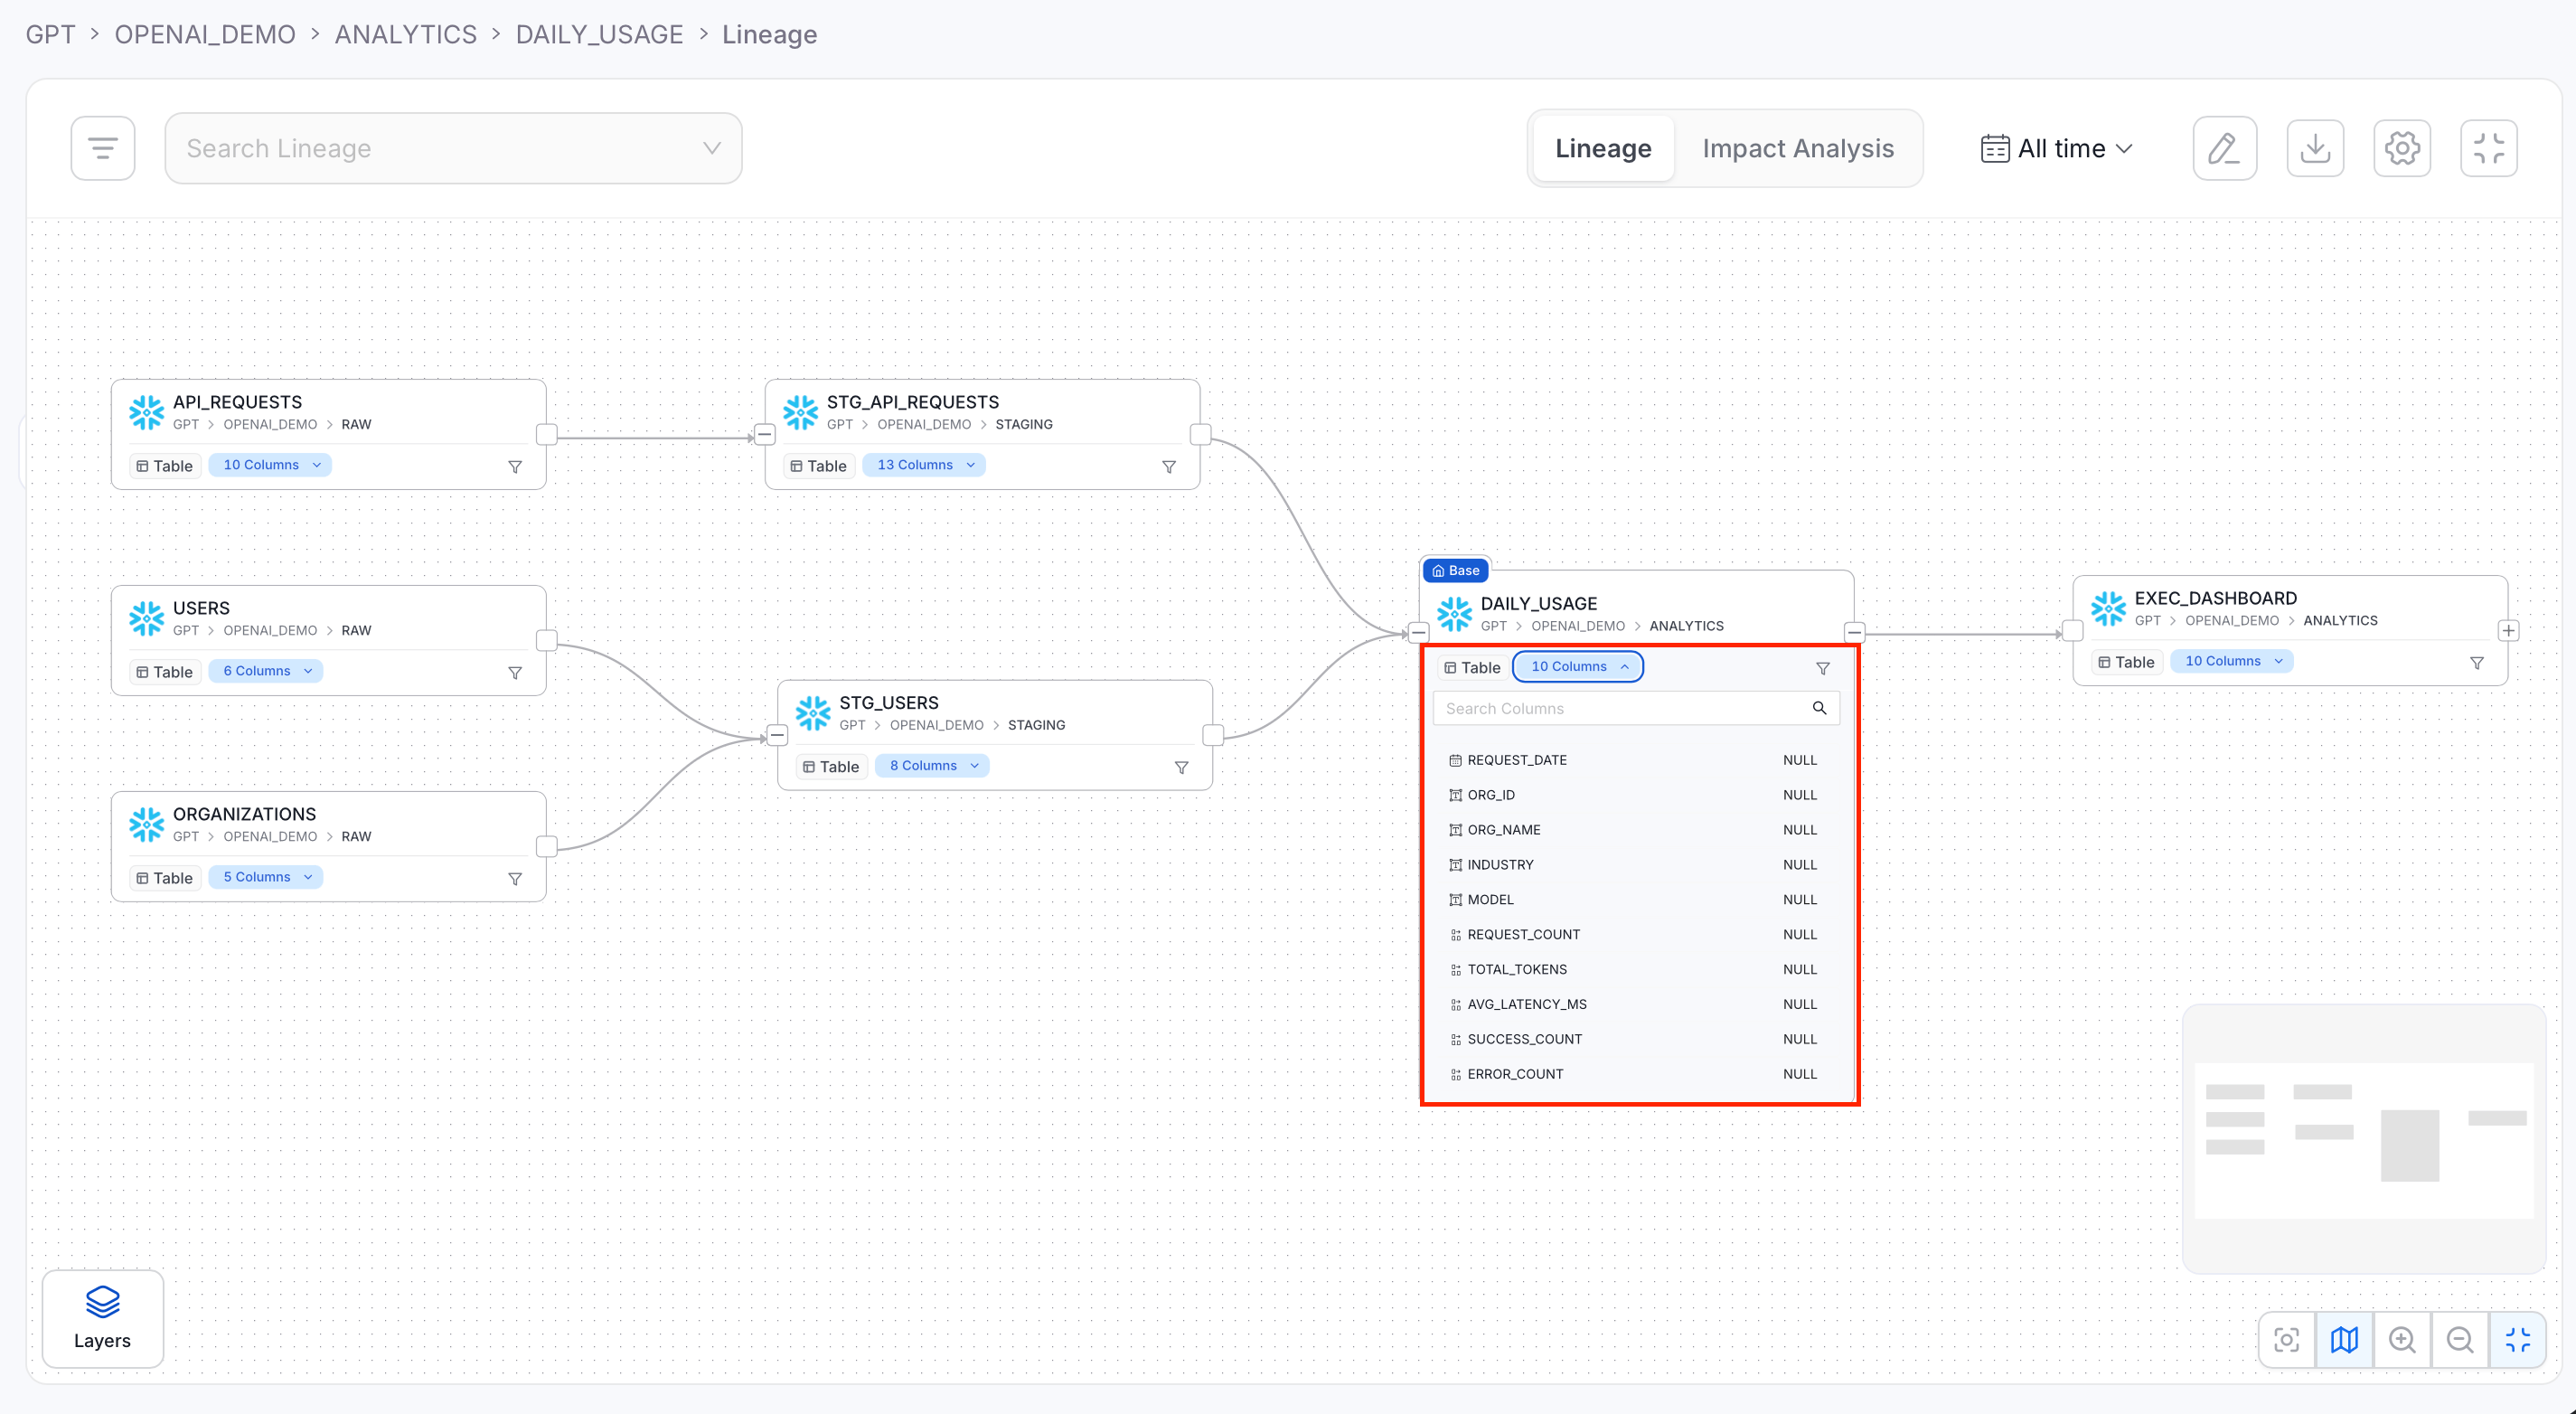
 ## Column-Level Lineage
Click a table to expand its list of columns and see column-level lineage.
## Column-Level Lineage
Click a table to expand its list of columns and see column-level lineage.
 ## Pipeline and Dashboard Lineage
For **Pipelines**:
* Lineage first comes from the metadata ingested from the databases.
* Setting up pipeline ingestion with a database service name links the pipeline to the database tables it reads from and writes to.
* If a pipeline creates the lineage, that shows up in the edge information too.
## Pipeline and Dashboard Lineage
For **Pipelines**:
* Lineage first comes from the metadata ingested from the databases.
* Setting up pipeline ingestion with a database service name links the pipeline to the database tables it reads from and writes to.
* If a pipeline creates the lineage, that shows up in the edge information too.
 **Dashboards** work the same way:
* Lineage first comes from the metadata ingested from the databases.
* Dashboard ingestion then adds the data models and charts, linking them back to the database tables they're built on.
## Lineage Layers
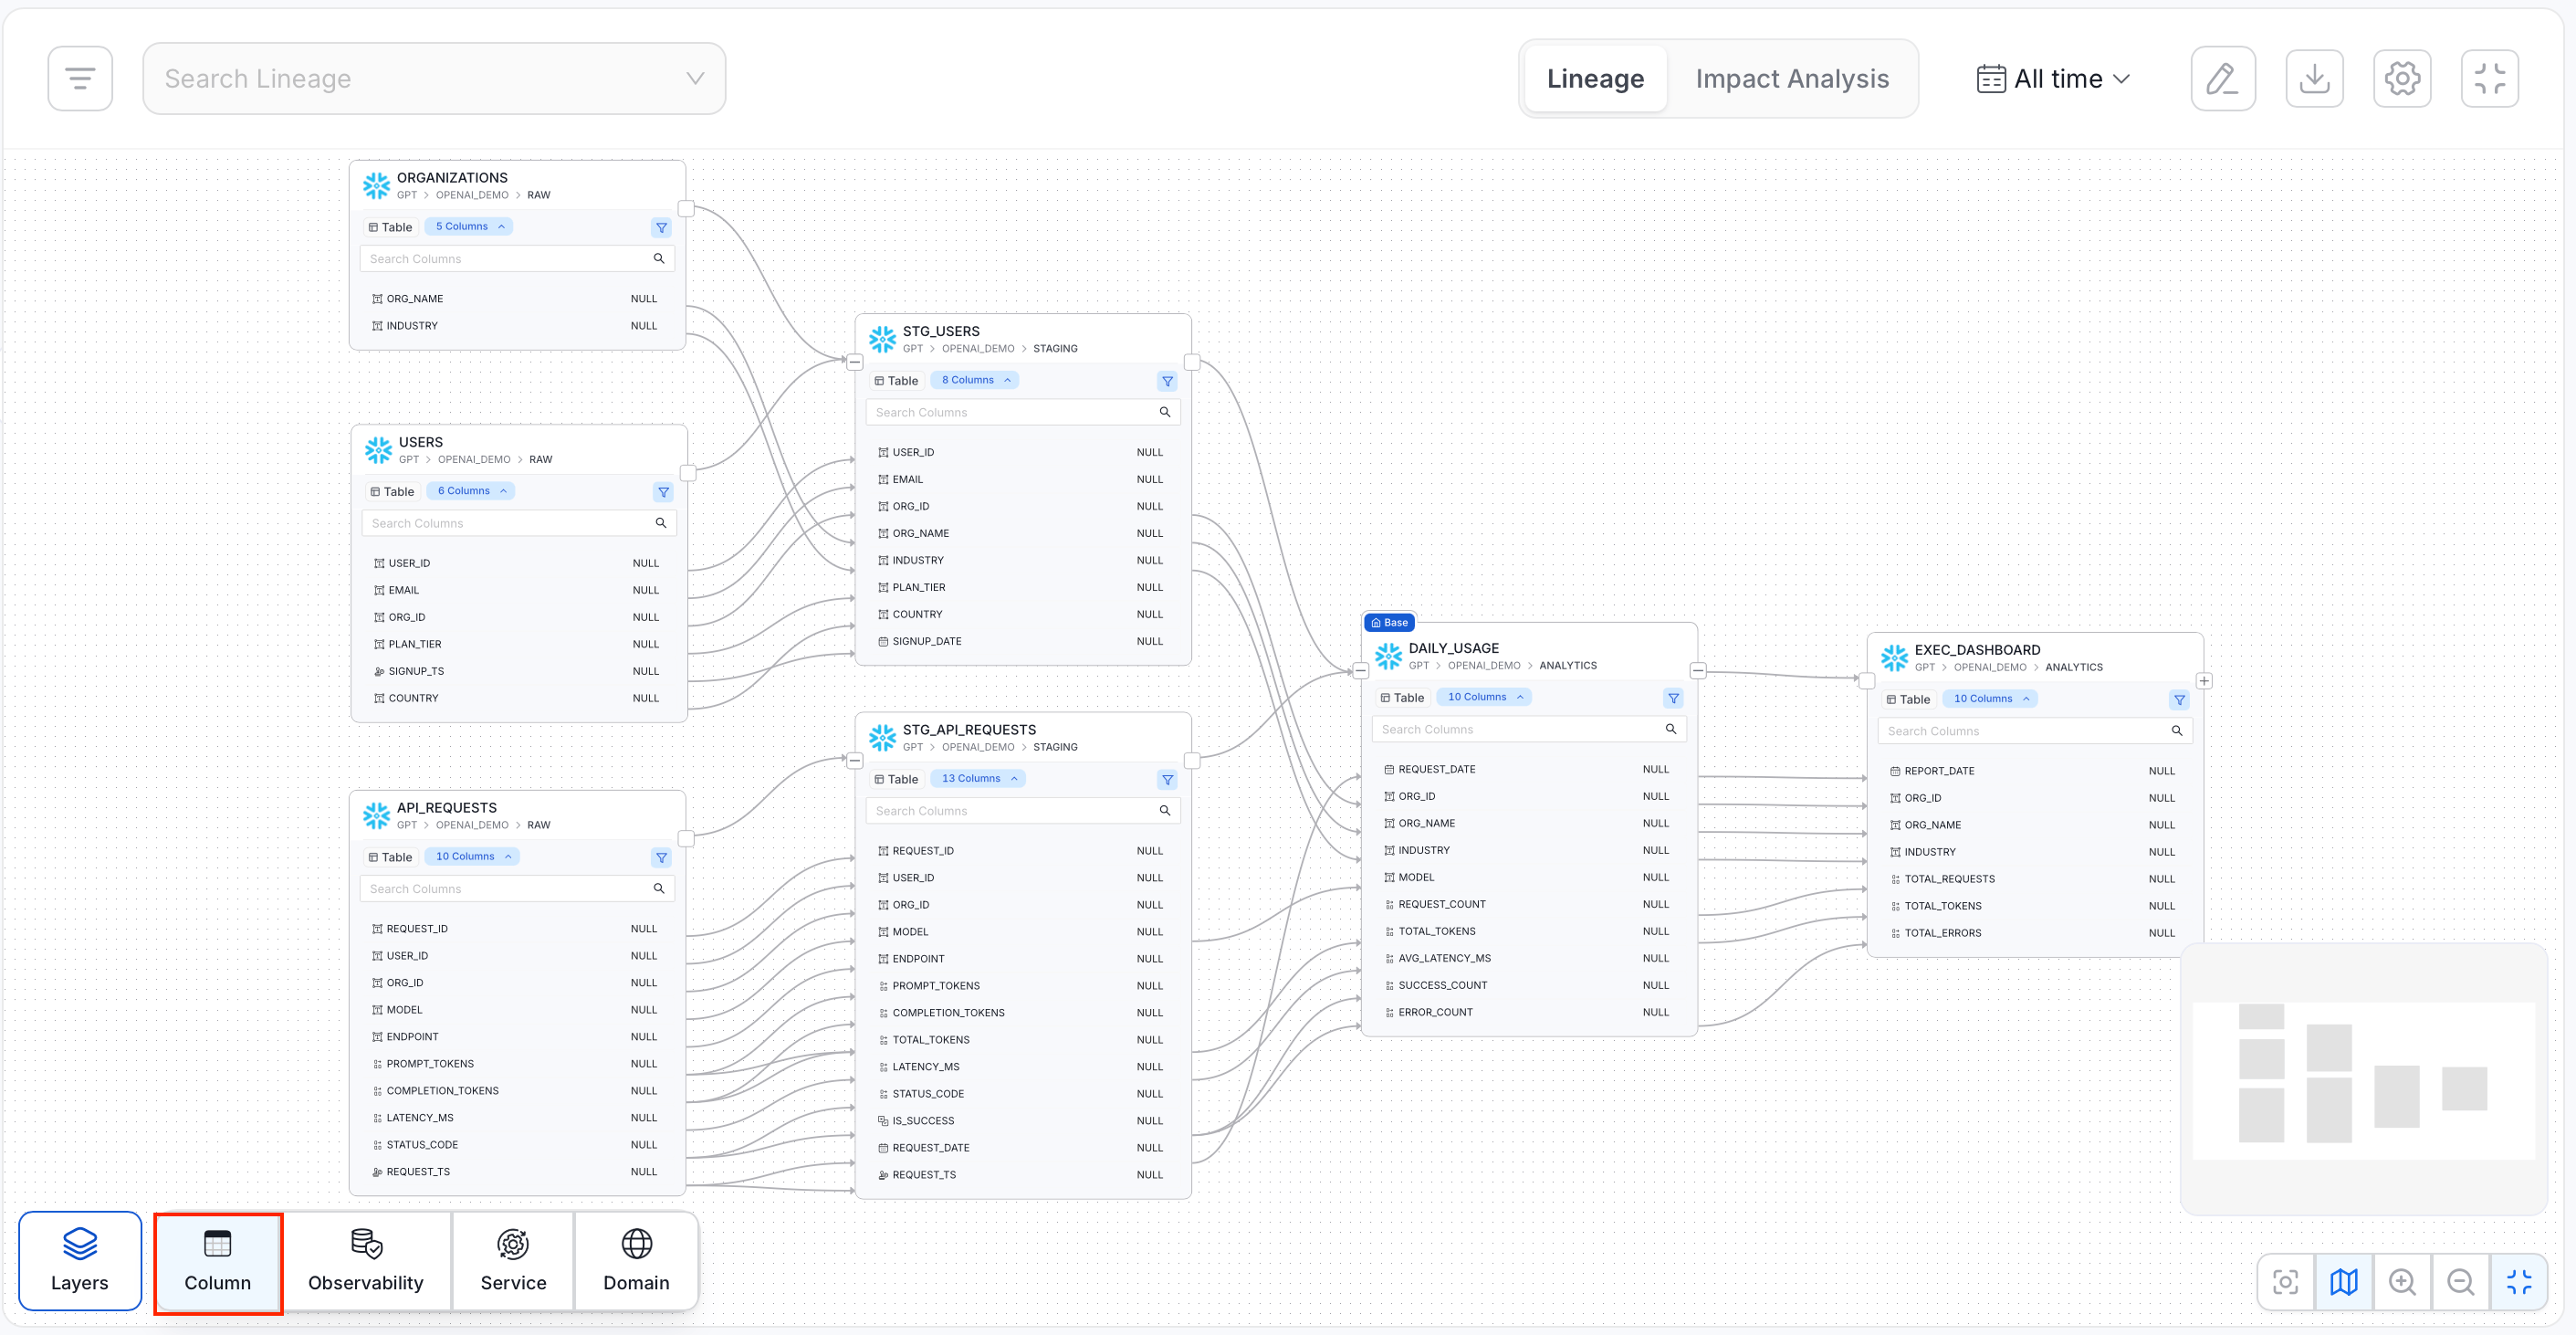
Lineage view supports multiple exploration layers that provide deeper insights into the structure, flow, and quality of data across your ecosystem. These layers help you visualize lineage not just at the dataset level, but also across services, domains, and business-critical data products.
### Column Layer
The **Column layer** enables detailed exploration of column-level lineage, letting you trace the flow and transformation of specific fields (for example, `customer_id`, `first_name`) across tables and pipelines. This granularity helps you understand data dependencies at the attribute level.
**Dashboards** work the same way:
* Lineage first comes from the metadata ingested from the databases.
* Dashboard ingestion then adds the data models and charts, linking them back to the database tables they're built on.
## Lineage Layers
Lineage view supports multiple exploration layers that provide deeper insights into the structure, flow, and quality of data across your ecosystem. These layers help you visualize lineage not just at the dataset level, but also across services, domains, and business-critical data products.
### Column Layer
The **Column layer** enables detailed exploration of column-level lineage, letting you trace the flow and transformation of specific fields (for example, `customer_id`, `first_name`) across tables and pipelines. This granularity helps you understand data dependencies at the attribute level.
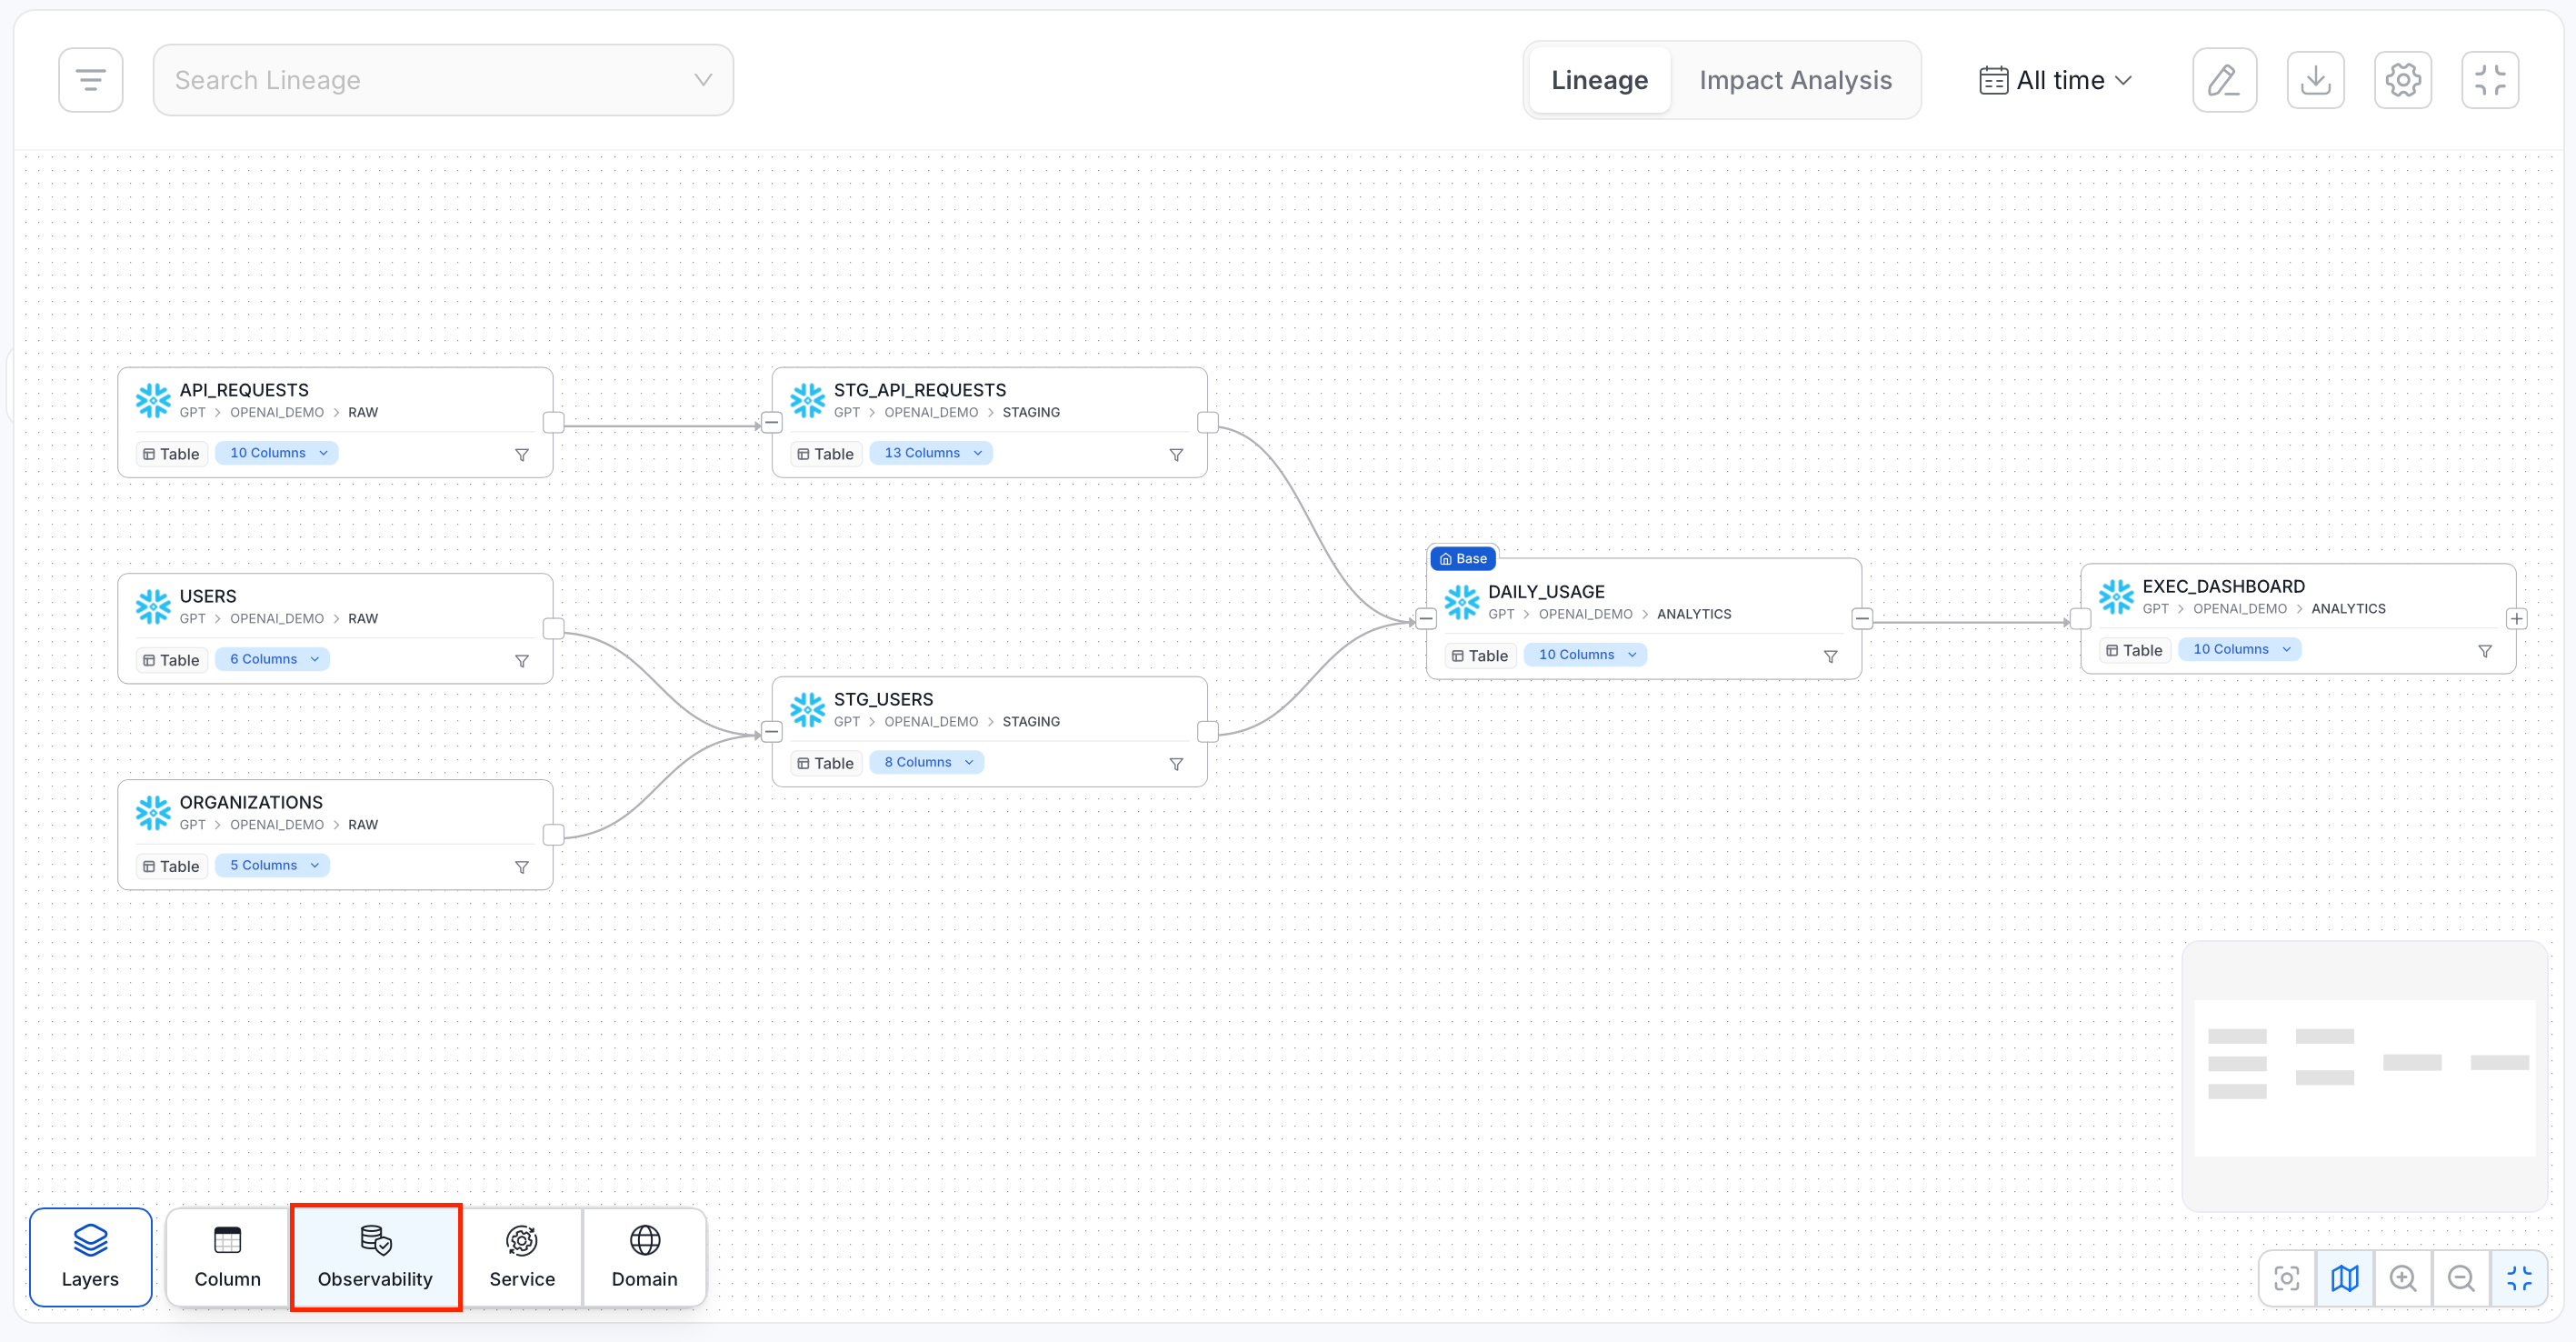
 ### Observability Layer
The **Observability layer** integrates data quality insights directly into lineage by displaying test outcomes such as passes, failures, and pending checks. This helps you identify potential issues and assess the trustworthiness of data as it moves through the pipeline.
### Observability Layer
The **Observability layer** integrates data quality insights directly into lineage by displaying test outcomes such as passes, failures, and pending checks. This helps you identify potential issues and assess the trustworthiness of data as it moves through the pipeline.
 ### Service Layer
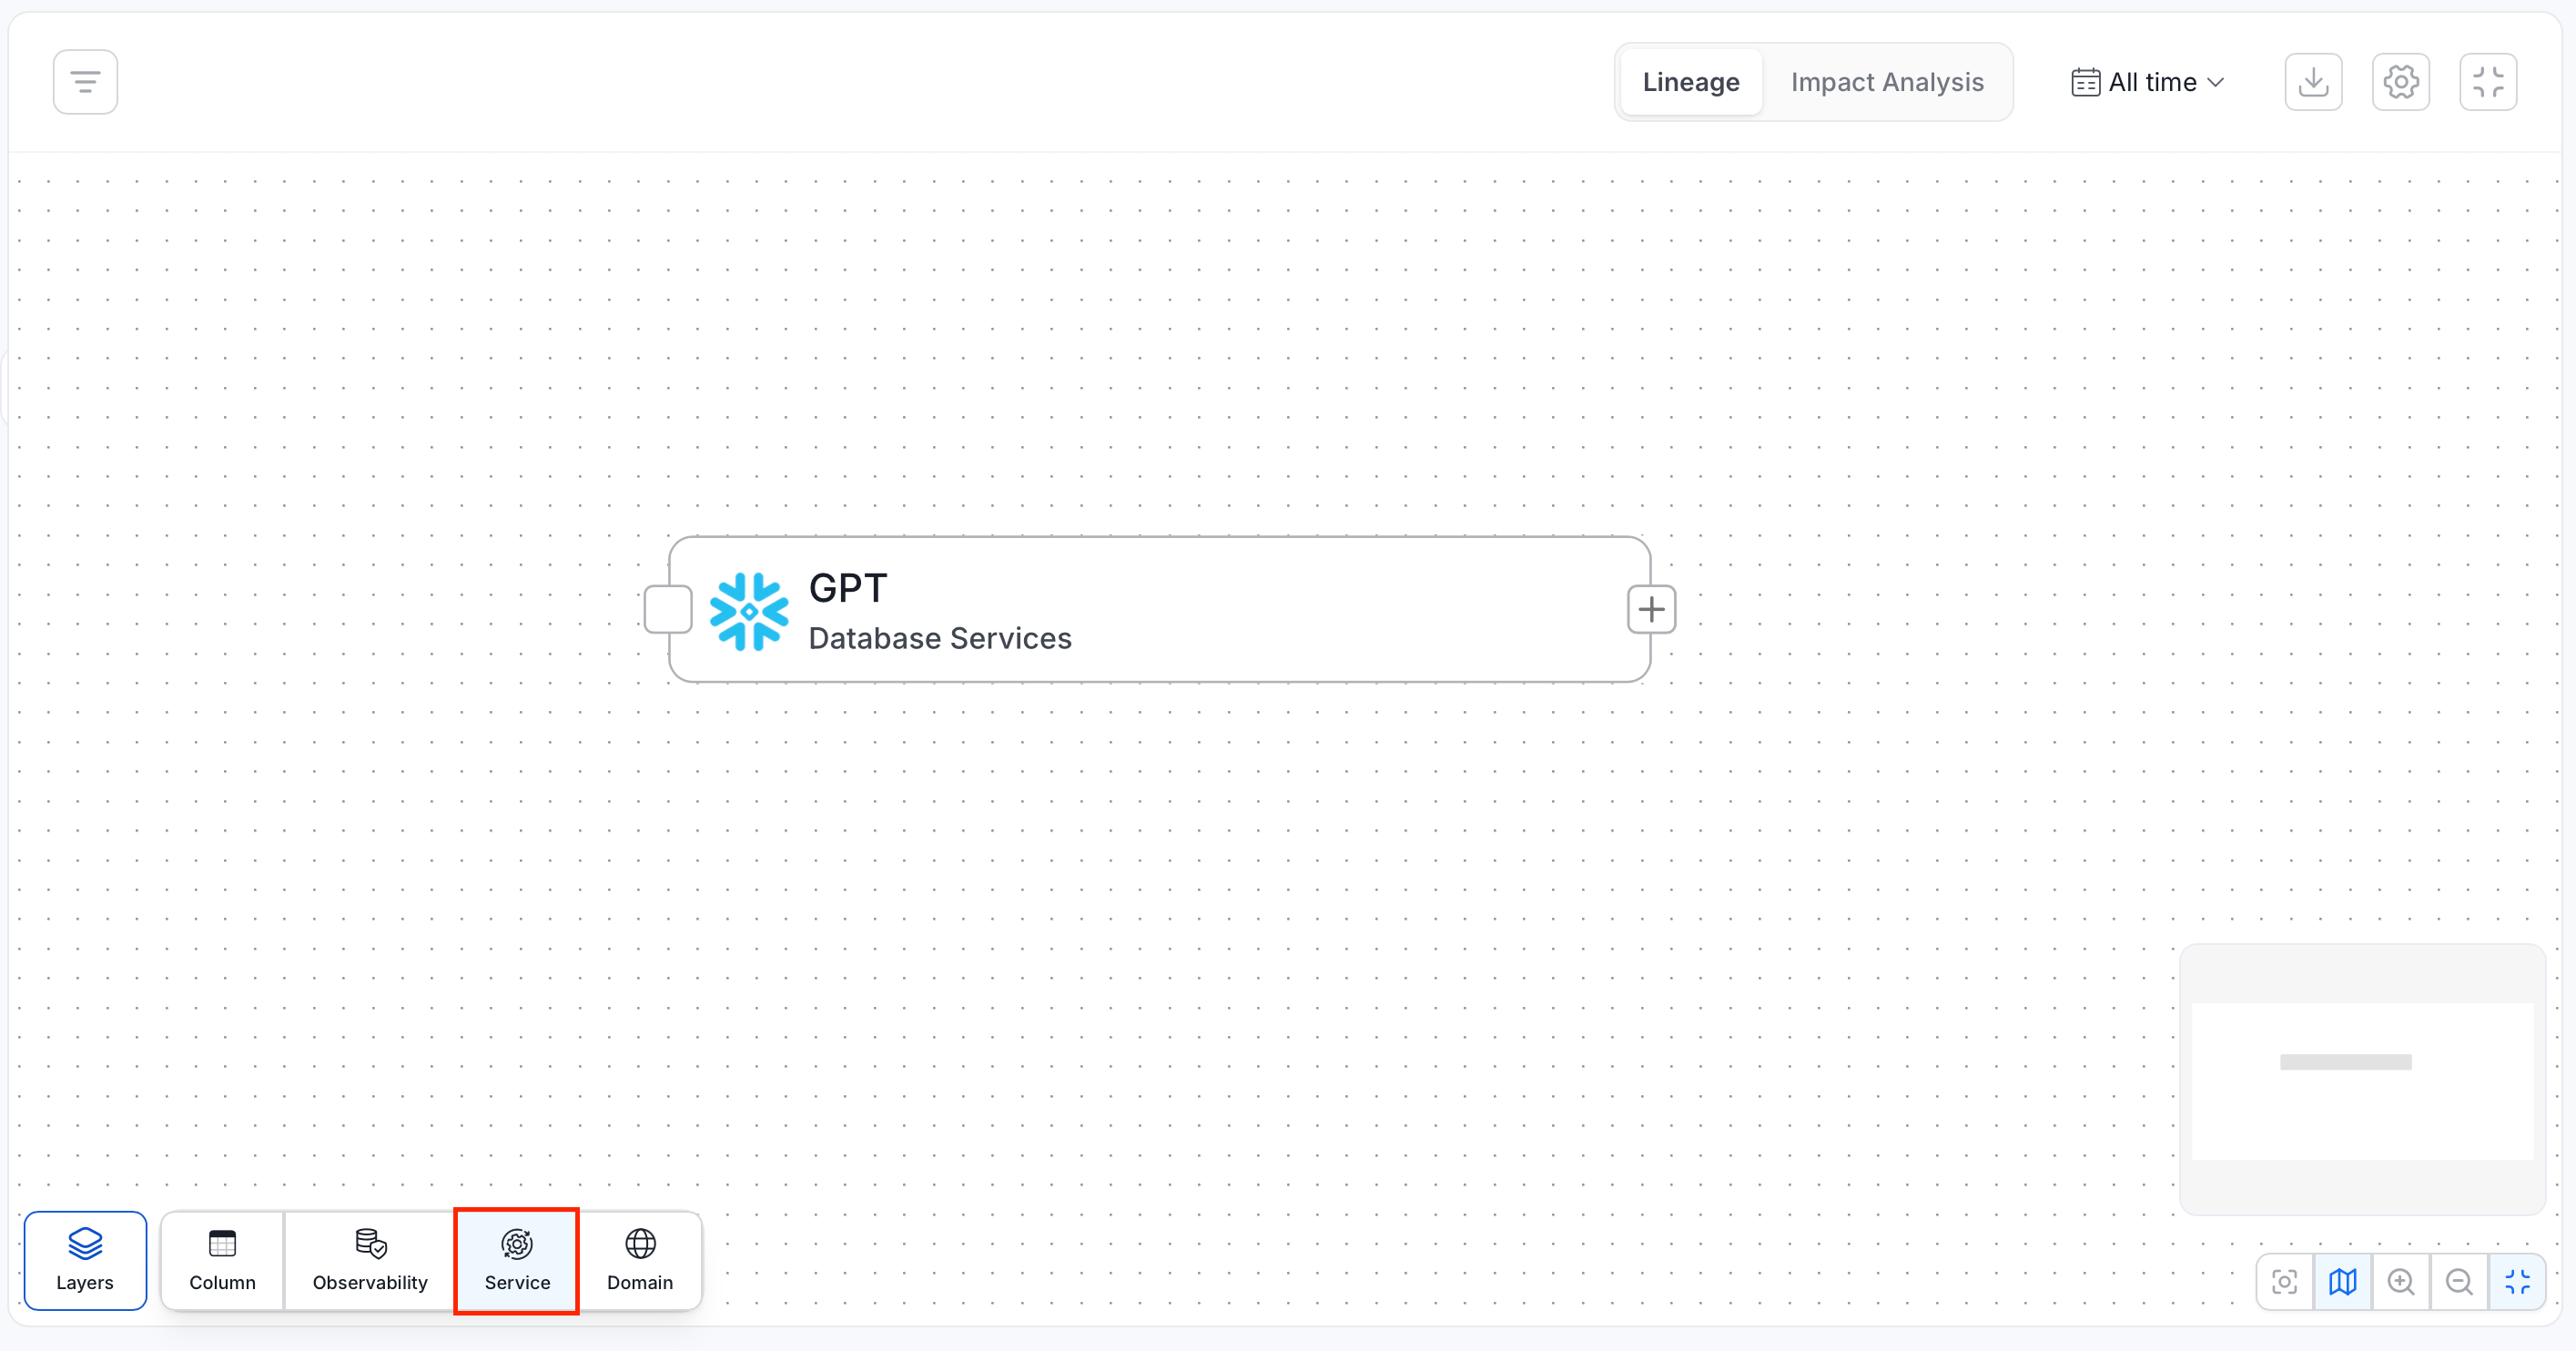
The **Service layer** visualizes how data flows across different platforms and services like Hive, Redshift, Power BI, and Tableau. It connects ingestion, transformation, and consumption points, offering a system-level view of the end-to-end data journey.
### Service Layer
The **Service layer** visualizes how data flows across different platforms and services like Hive, Redshift, Power BI, and Tableau. It connects ingestion, transformation, and consumption points, offering a system-level view of the end-to-end data journey.
 ### Domain Layer
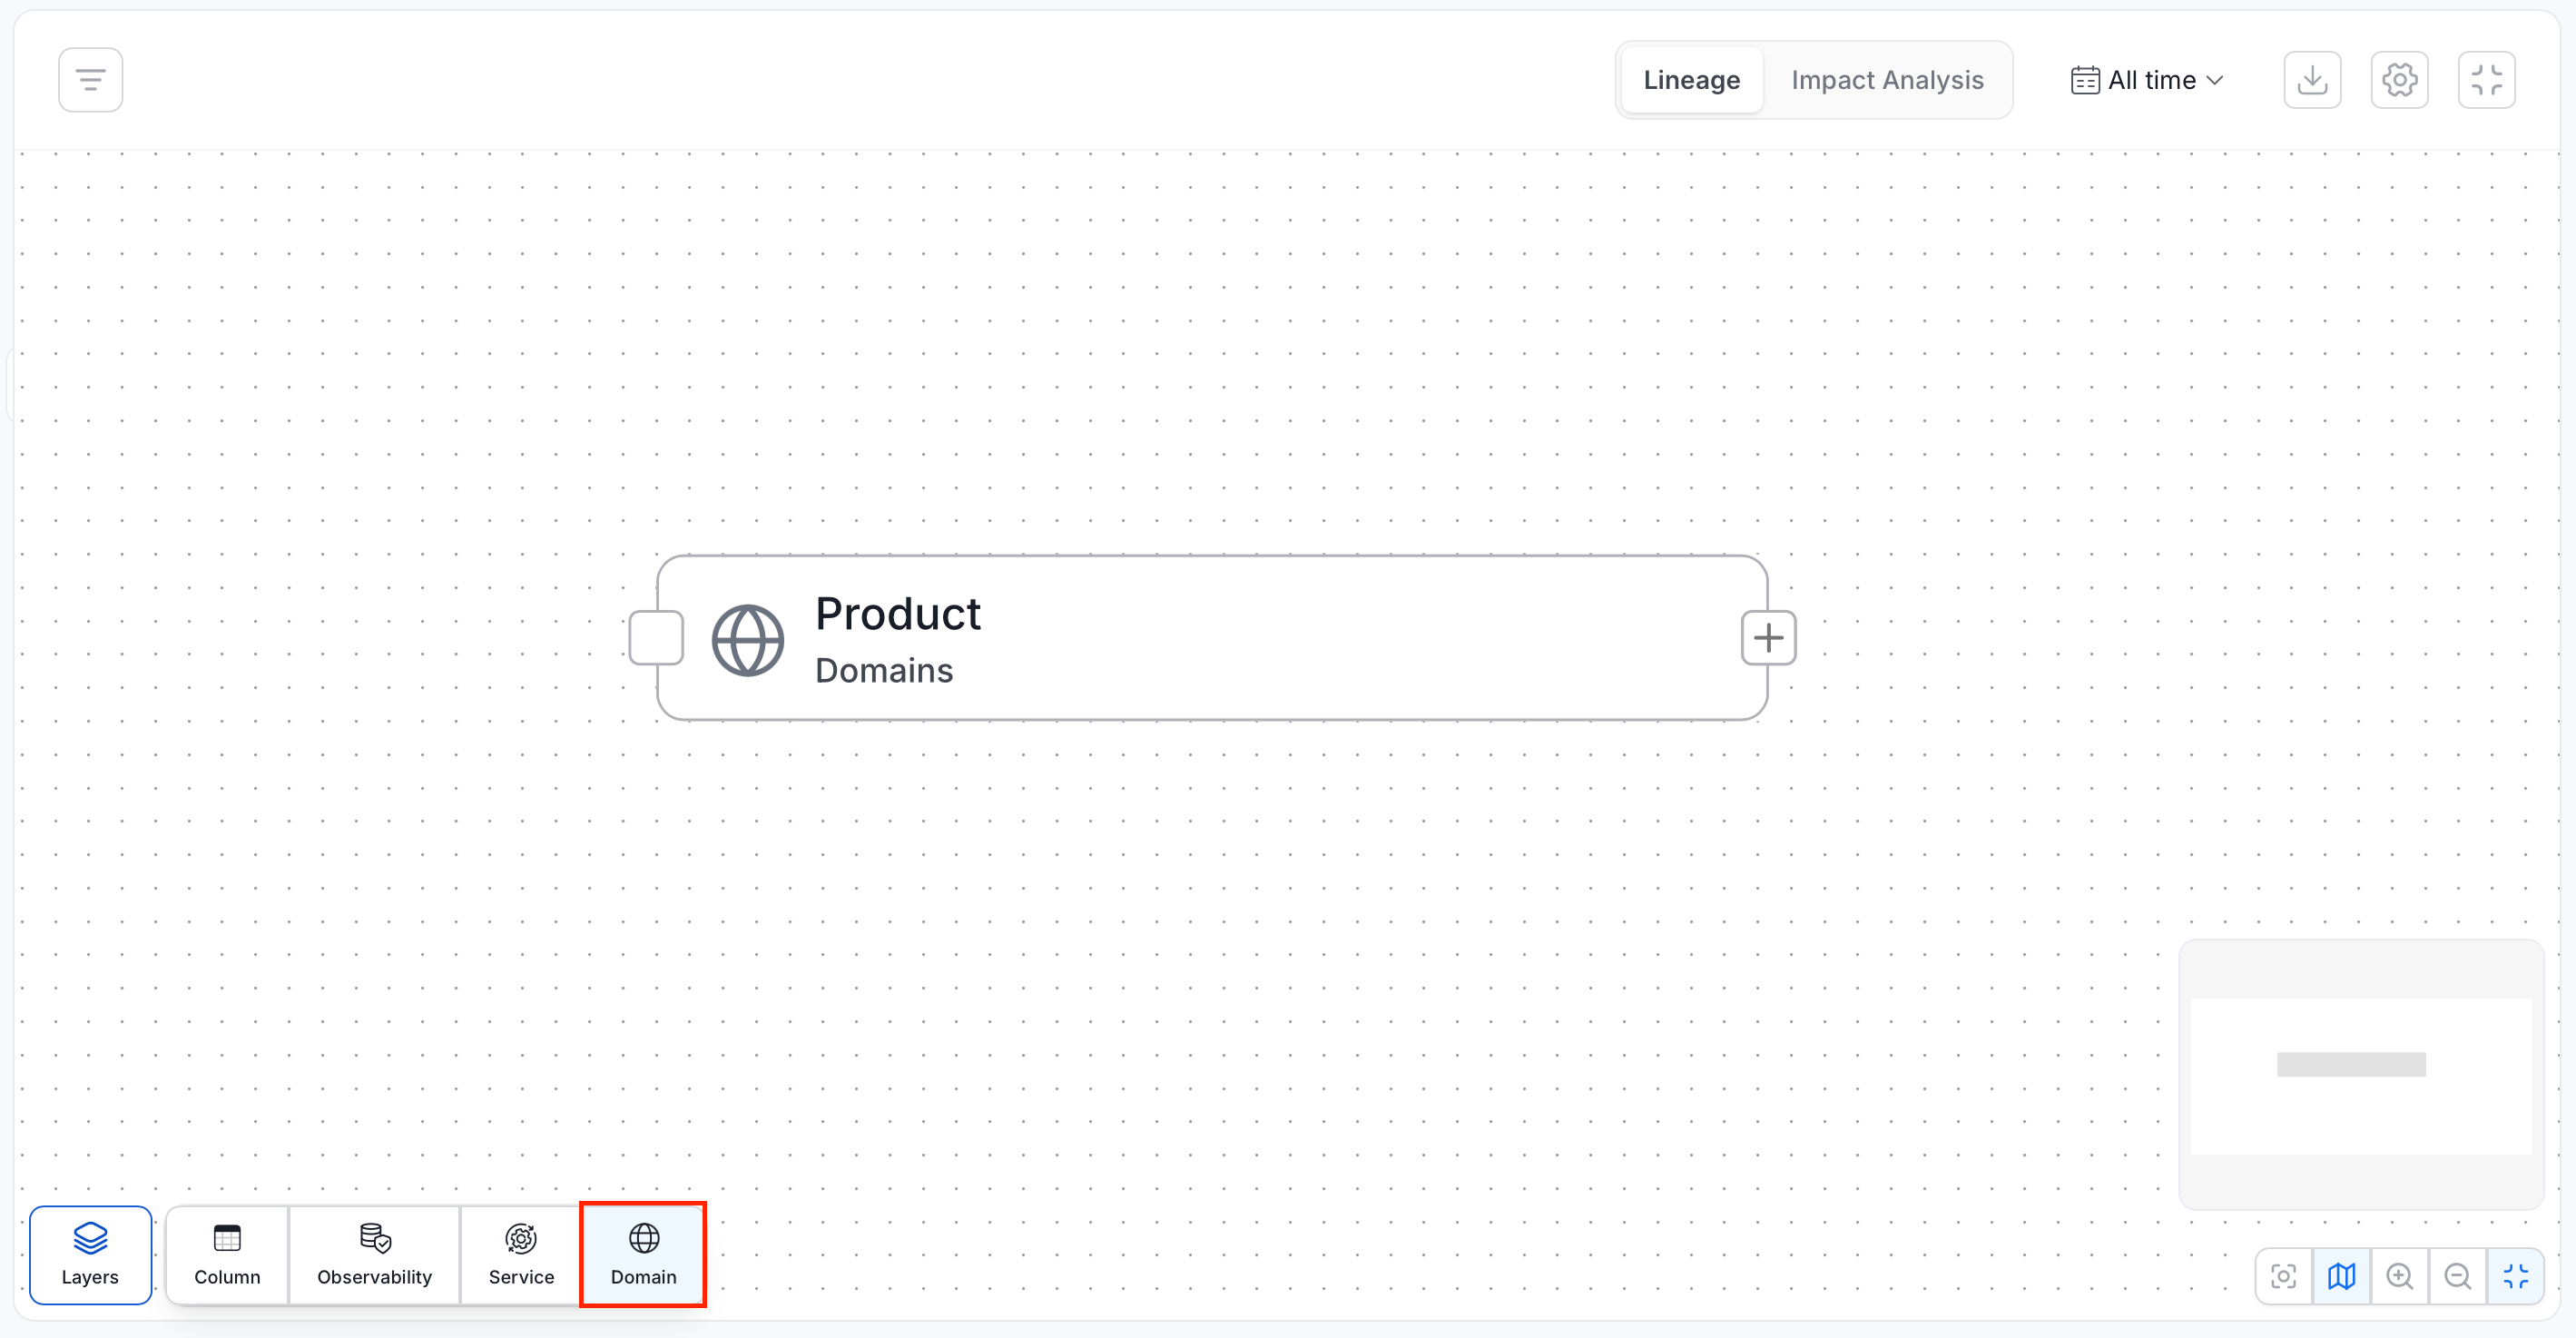
The **Domain layer** organizes datasets and assets into business-relevant categories such as "Ecommerce" or "Customer Data." This classification provides contextual clarity and supports governance by aligning technical assets with business functions.
### Domain Layer
The **Domain layer** organizes datasets and assets into business-relevant categories such as "Ecommerce" or "Customer Data." This classification provides contextual clarity and supports governance by aligning technical assets with business functions.
 ### Data Product Layer
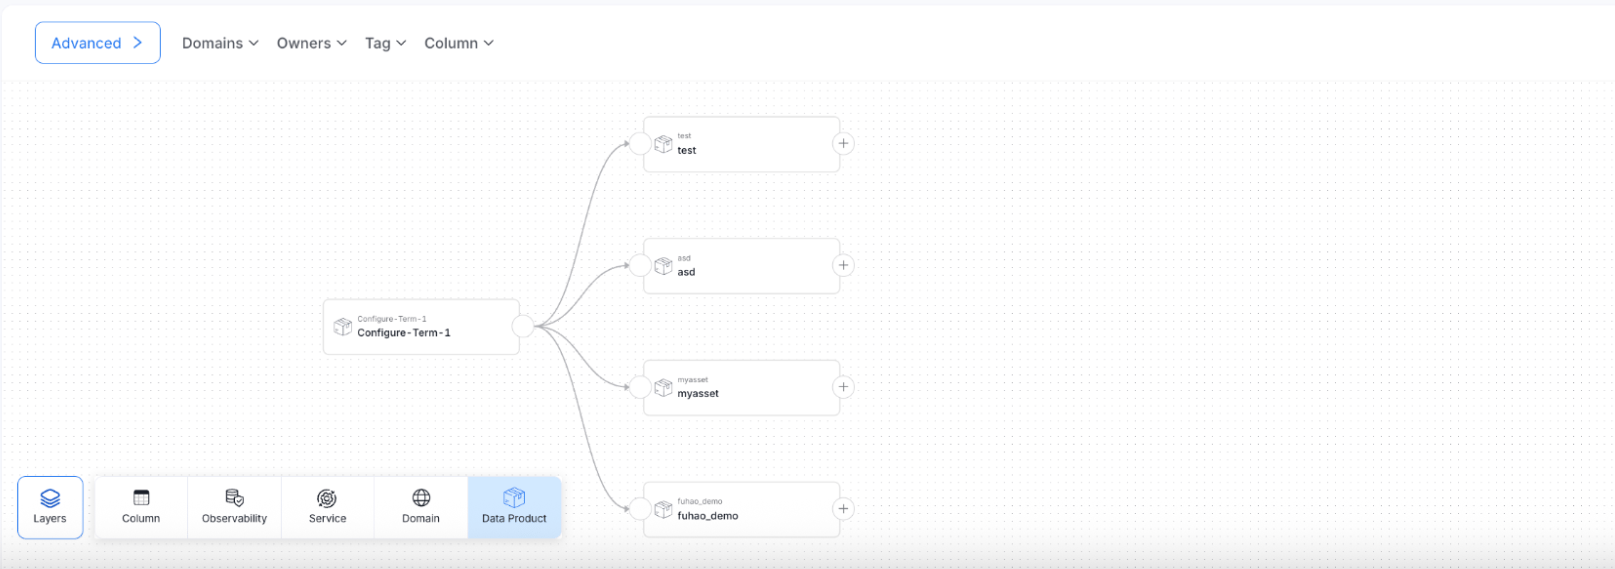
The **Data Product layer** highlights curated outputs like *Customer Registry* or *Superstore*, representing the final, value-delivering datasets within a domain. It enables you to track the lineage of trusted, consumption-ready data products across the organization.
### Data Product Layer
The **Data Product layer** highlights curated outputs like *Customer Registry* or *Superstore*, representing the final, value-delivering datasets within a domain. It enables you to track the lineage of trusted, consumption-ready data products across the organization.
 Explore and edit the rich column-level lineage.